User Guide
SimLab User Guide is divided into two main sections:
Demo Quickstart: a short tutorial introducing the SimLab workflow
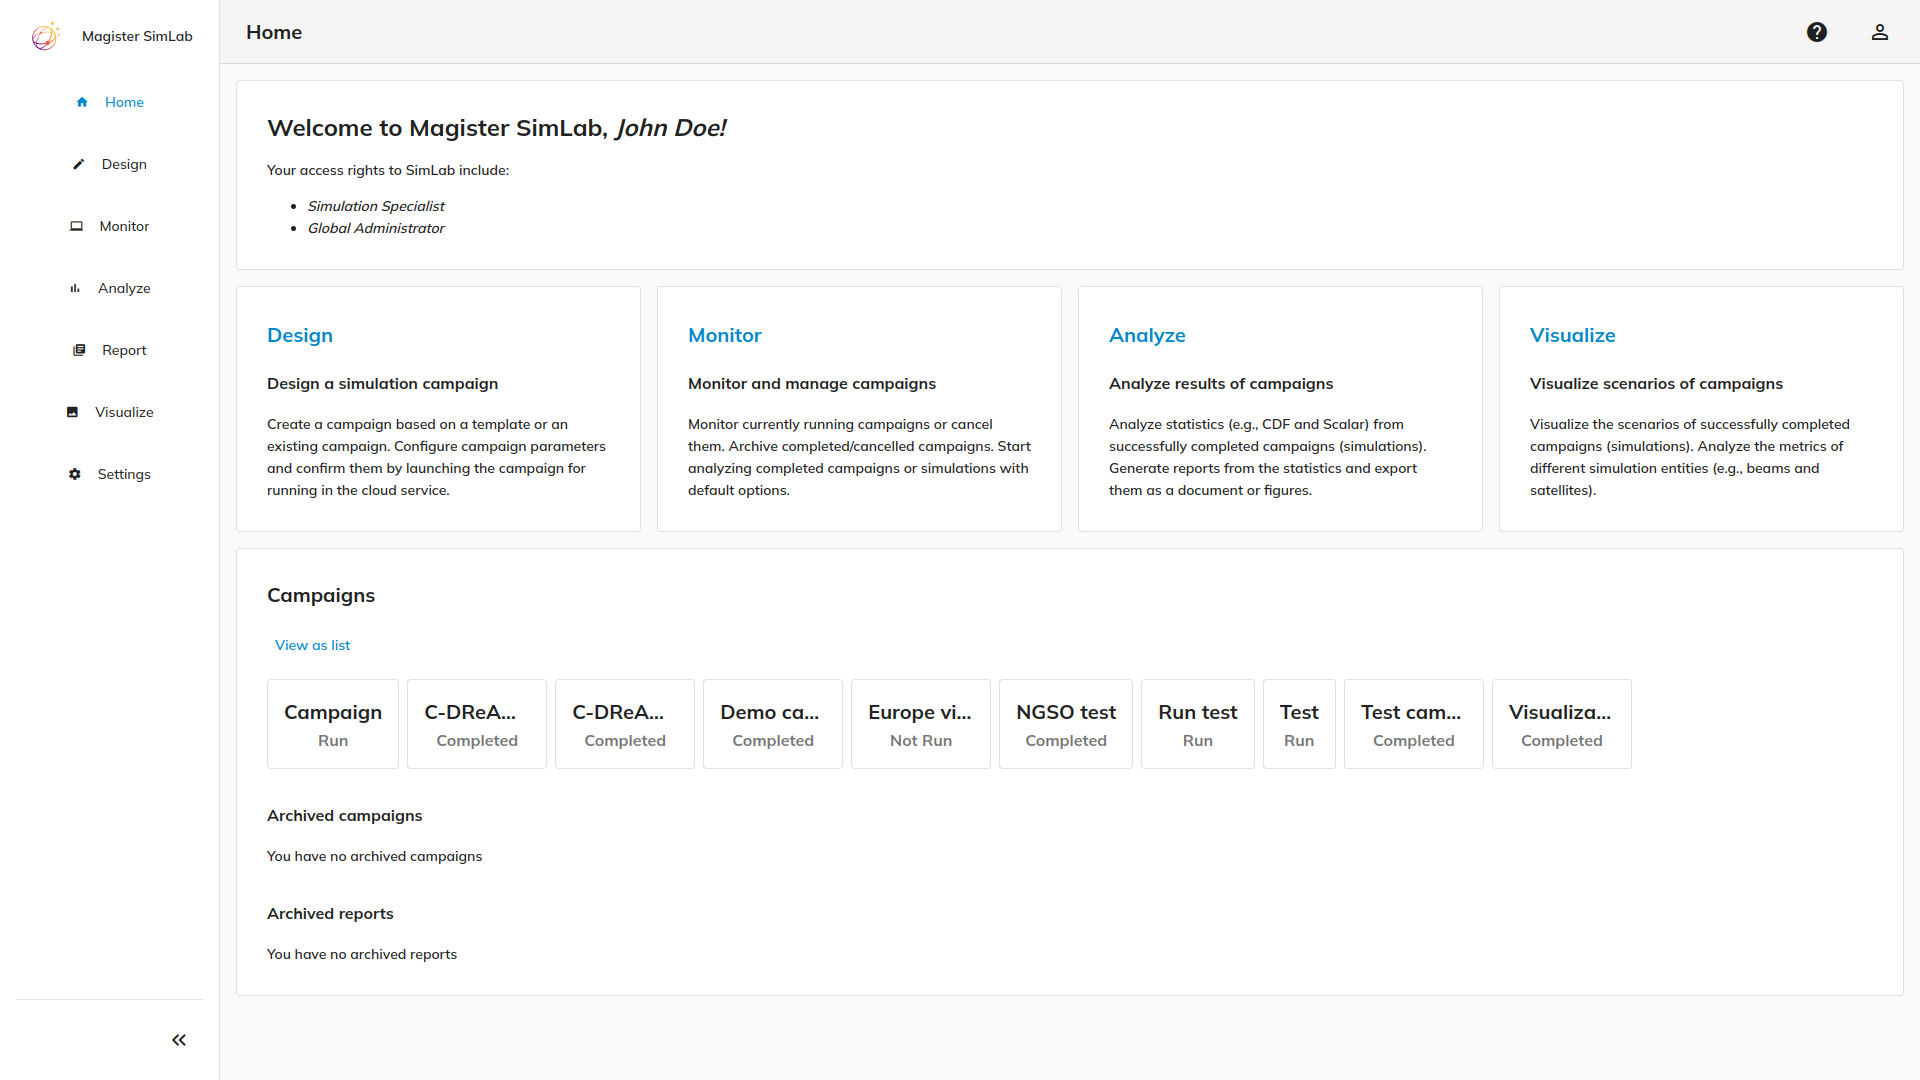
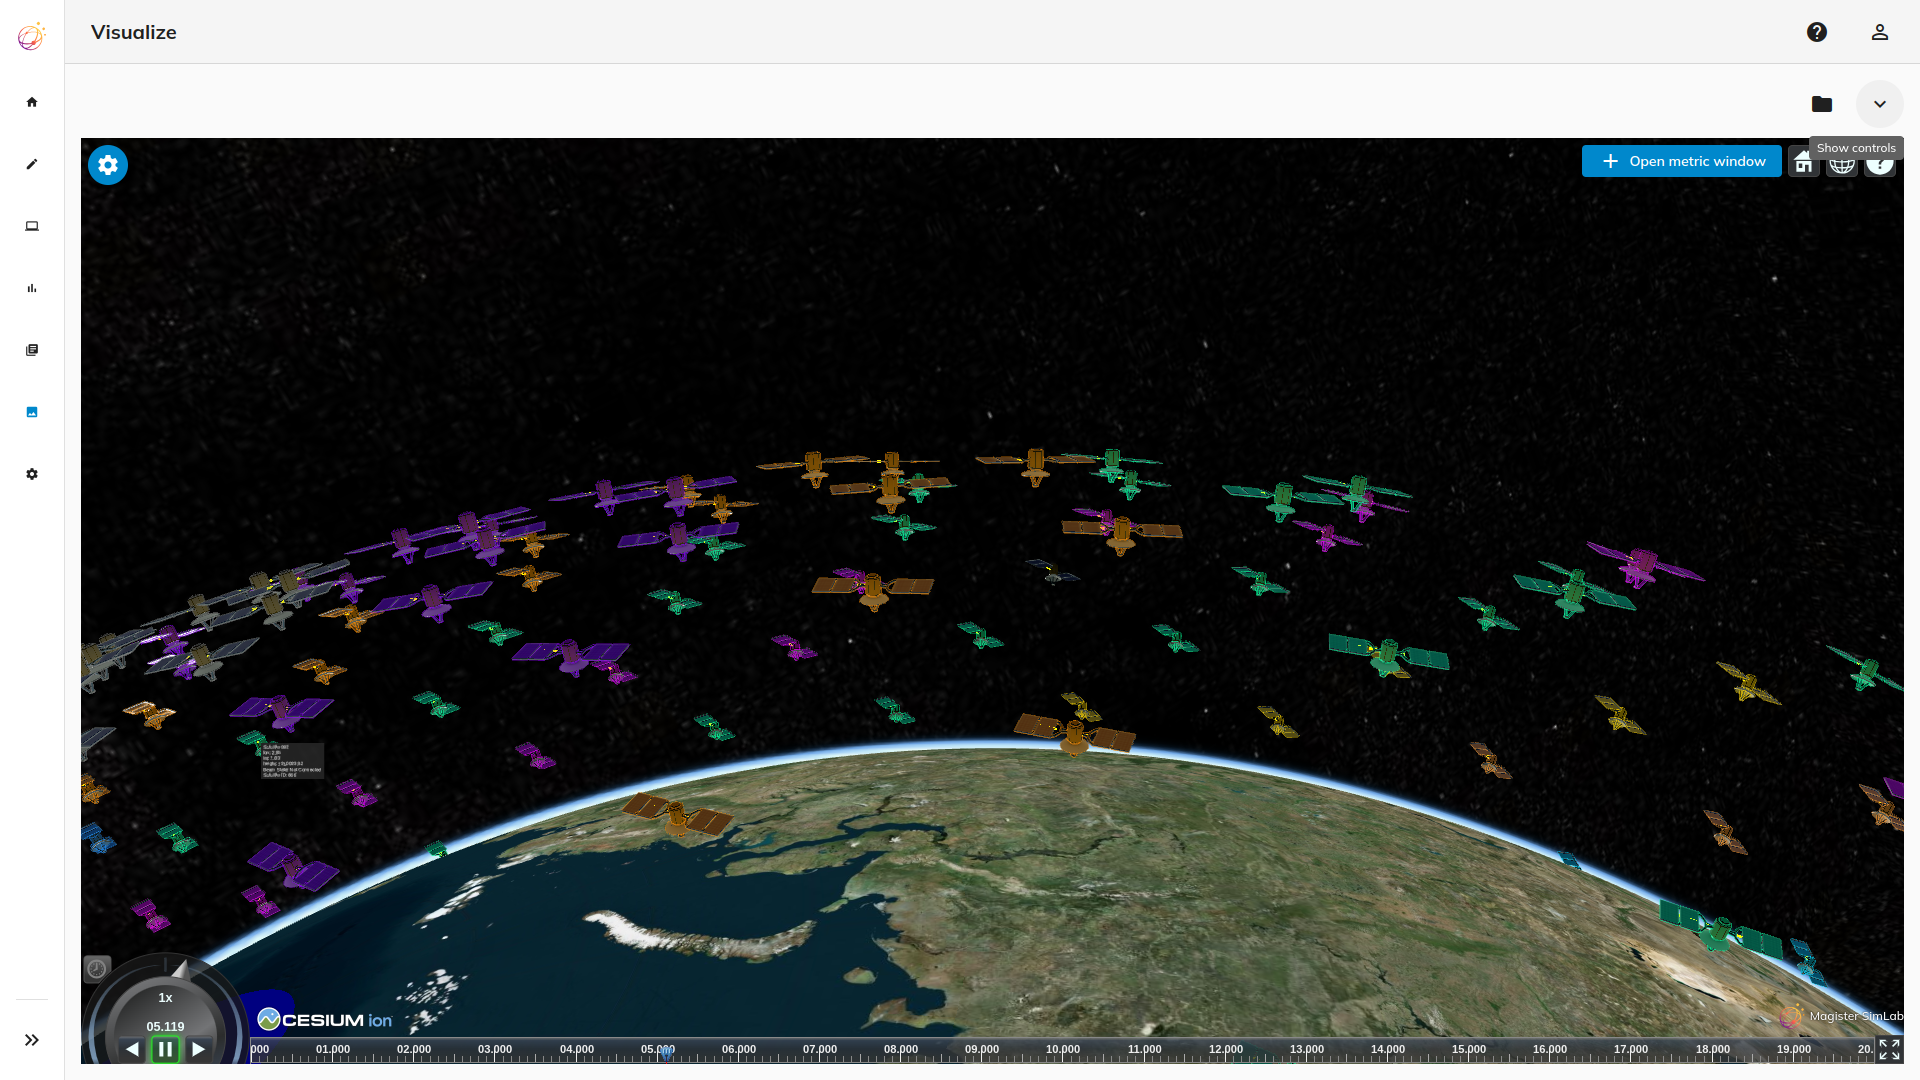
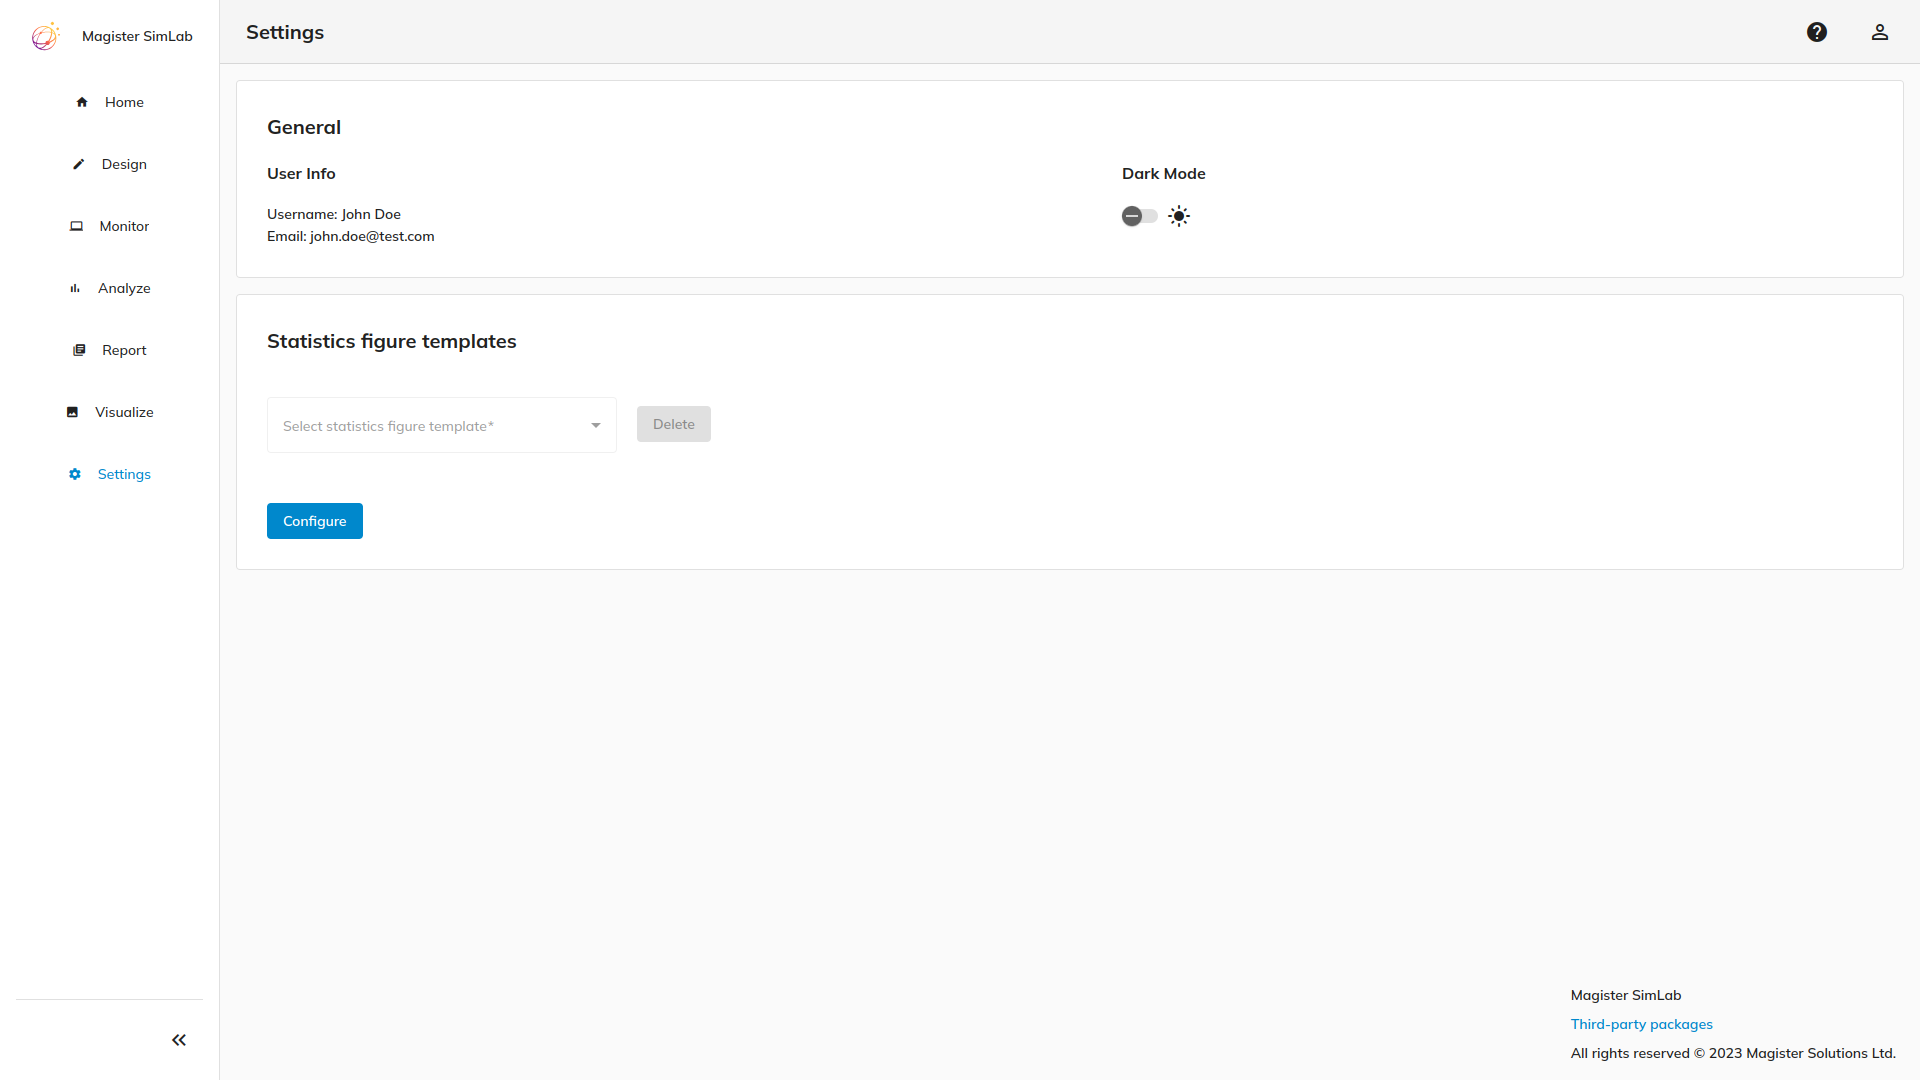
SimLab Workflow Phases: more specific information on different phases (Design, Monitor, Analyze and Visualize) of the SimLab workflow.
Demo Quickstart
In this tutorial, we'll introduce the SimLab workflow by going through the steps of designing, monitoring and analyzing a simulation campaign. Tutorial has the following steps:
Login to SimLab
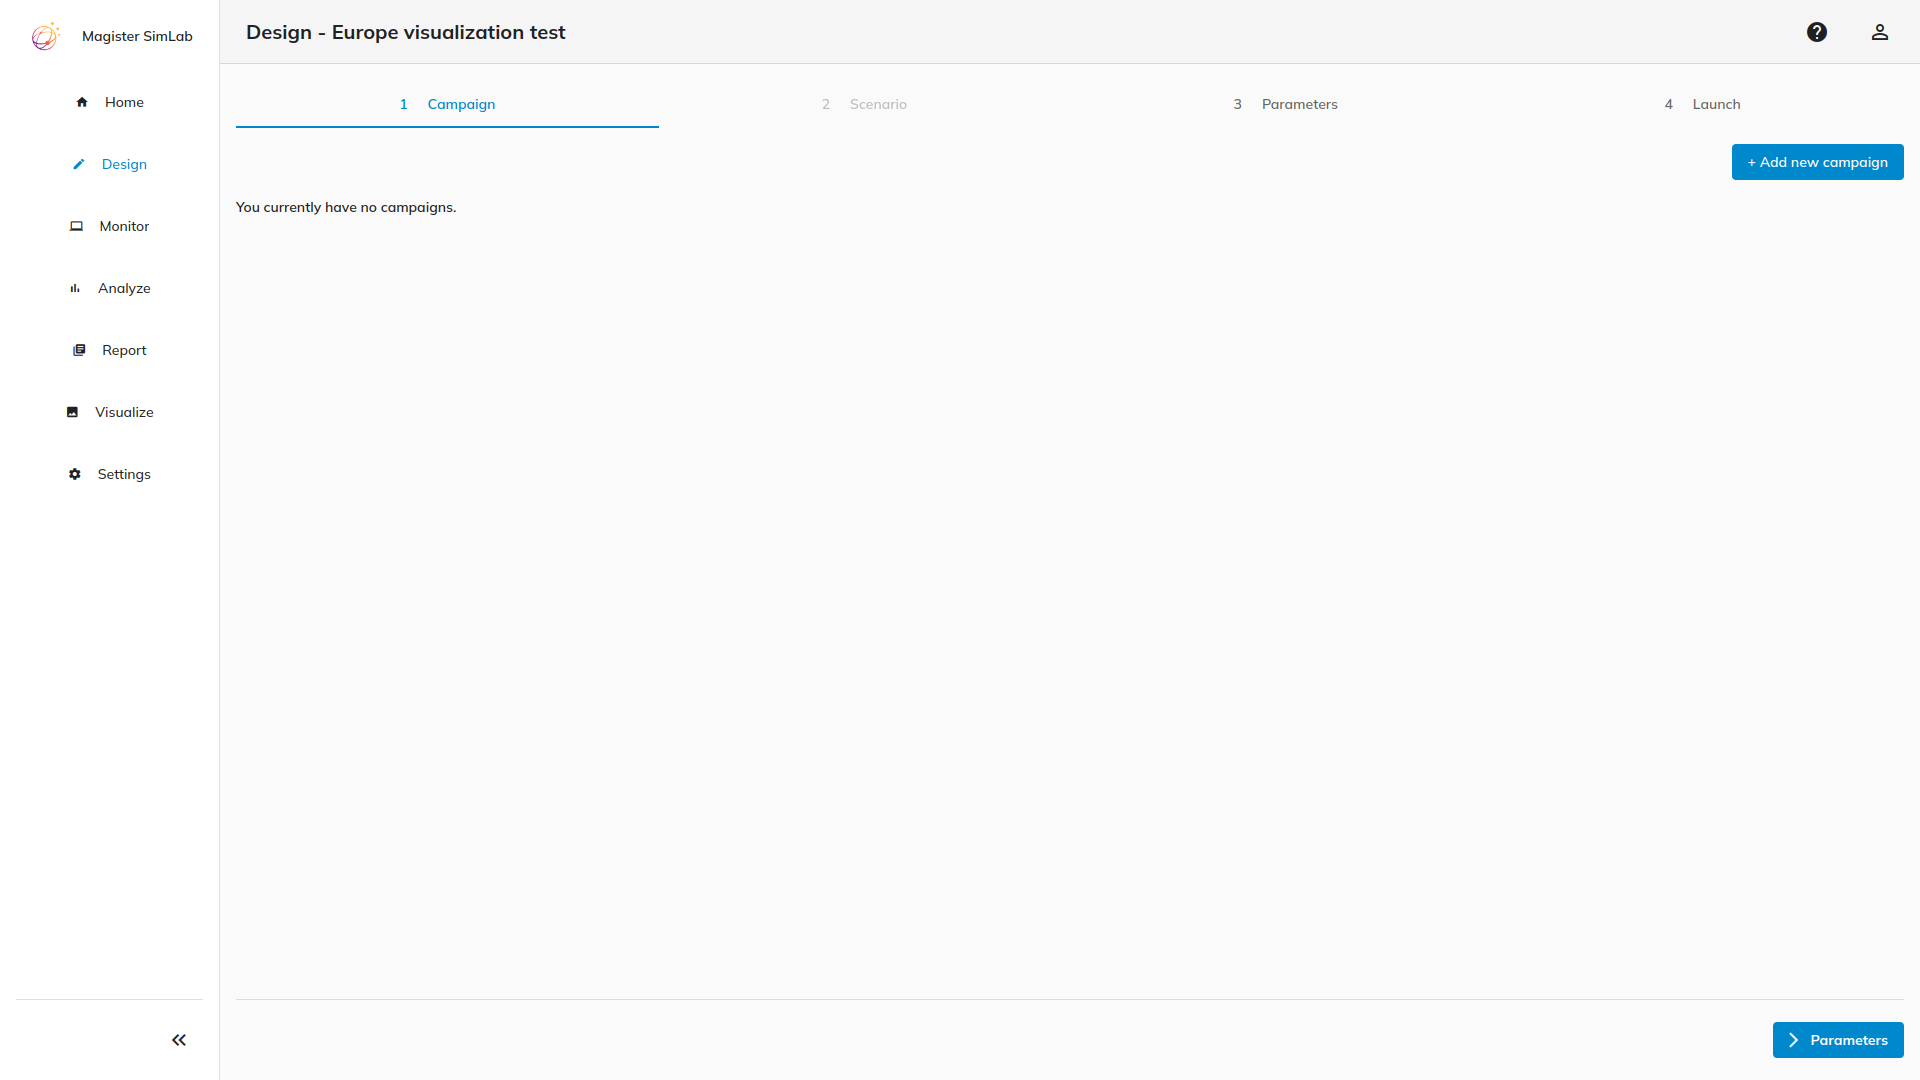
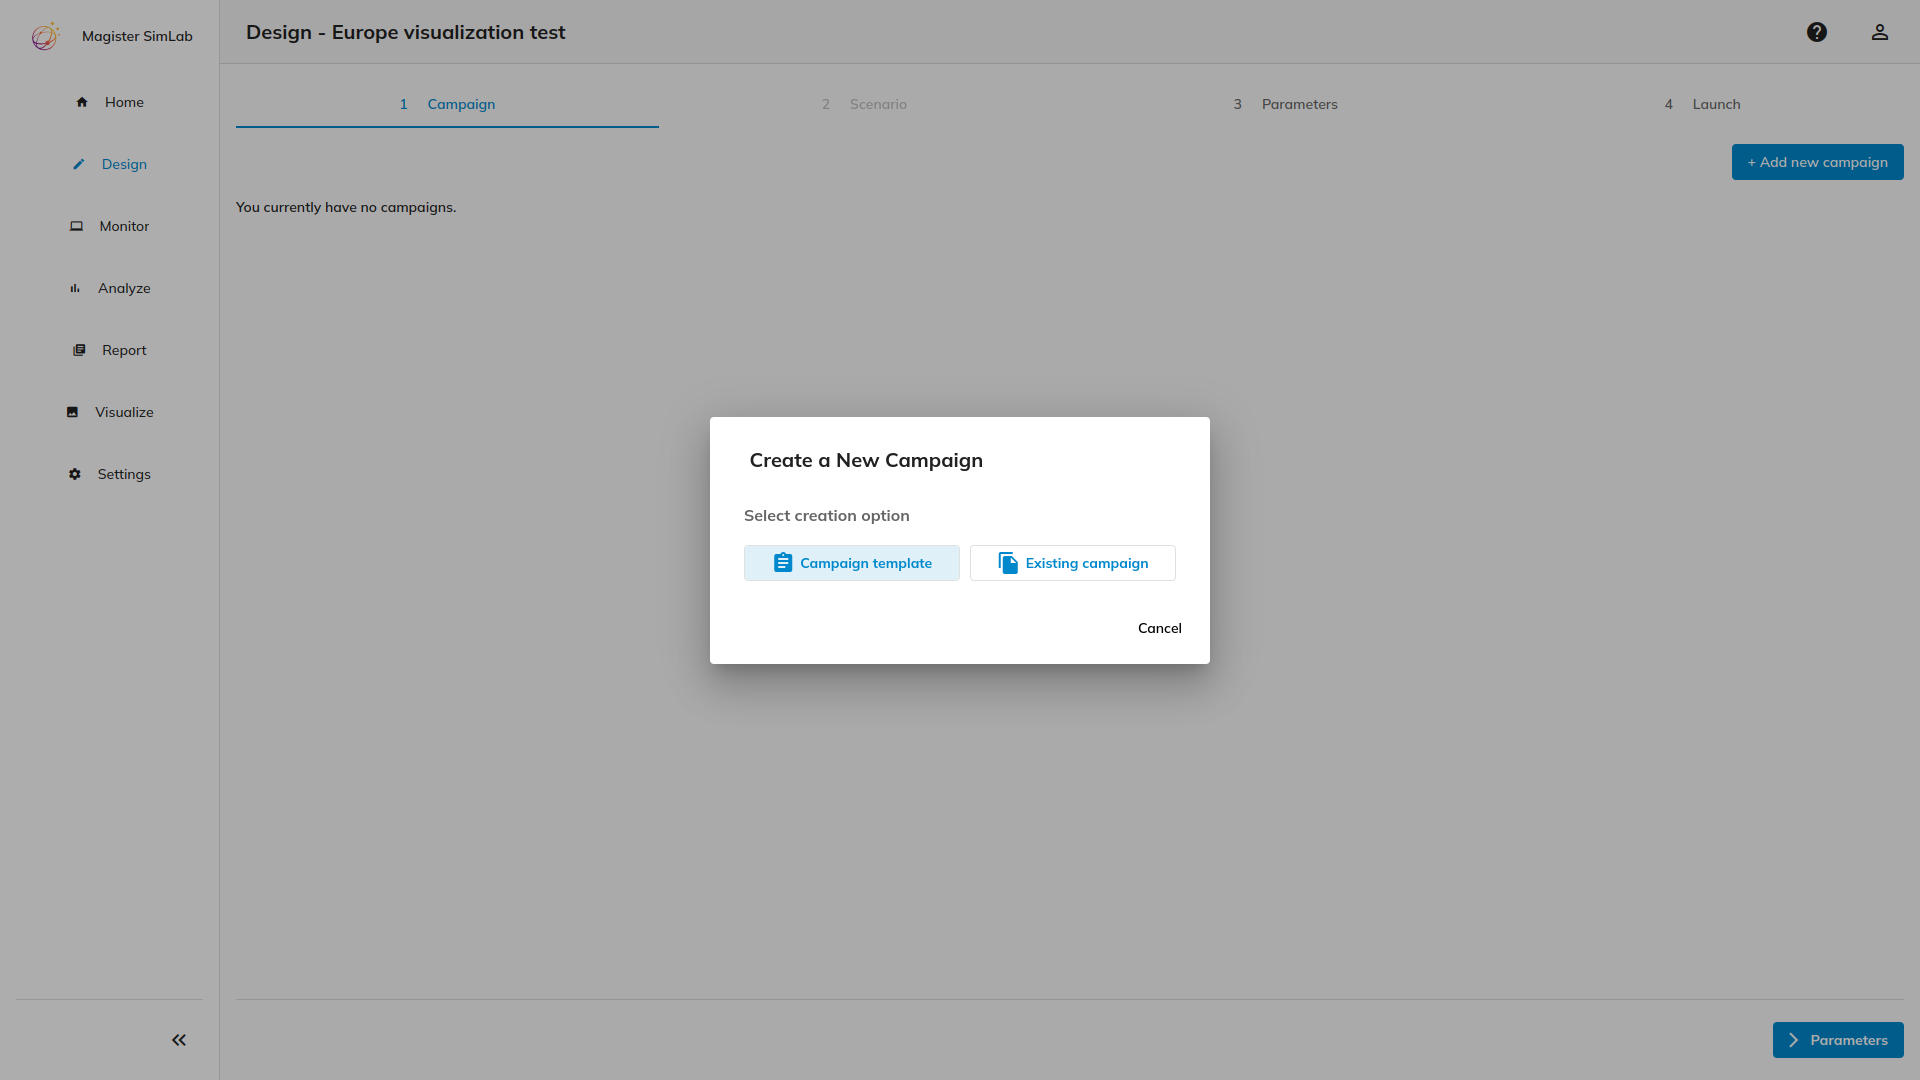
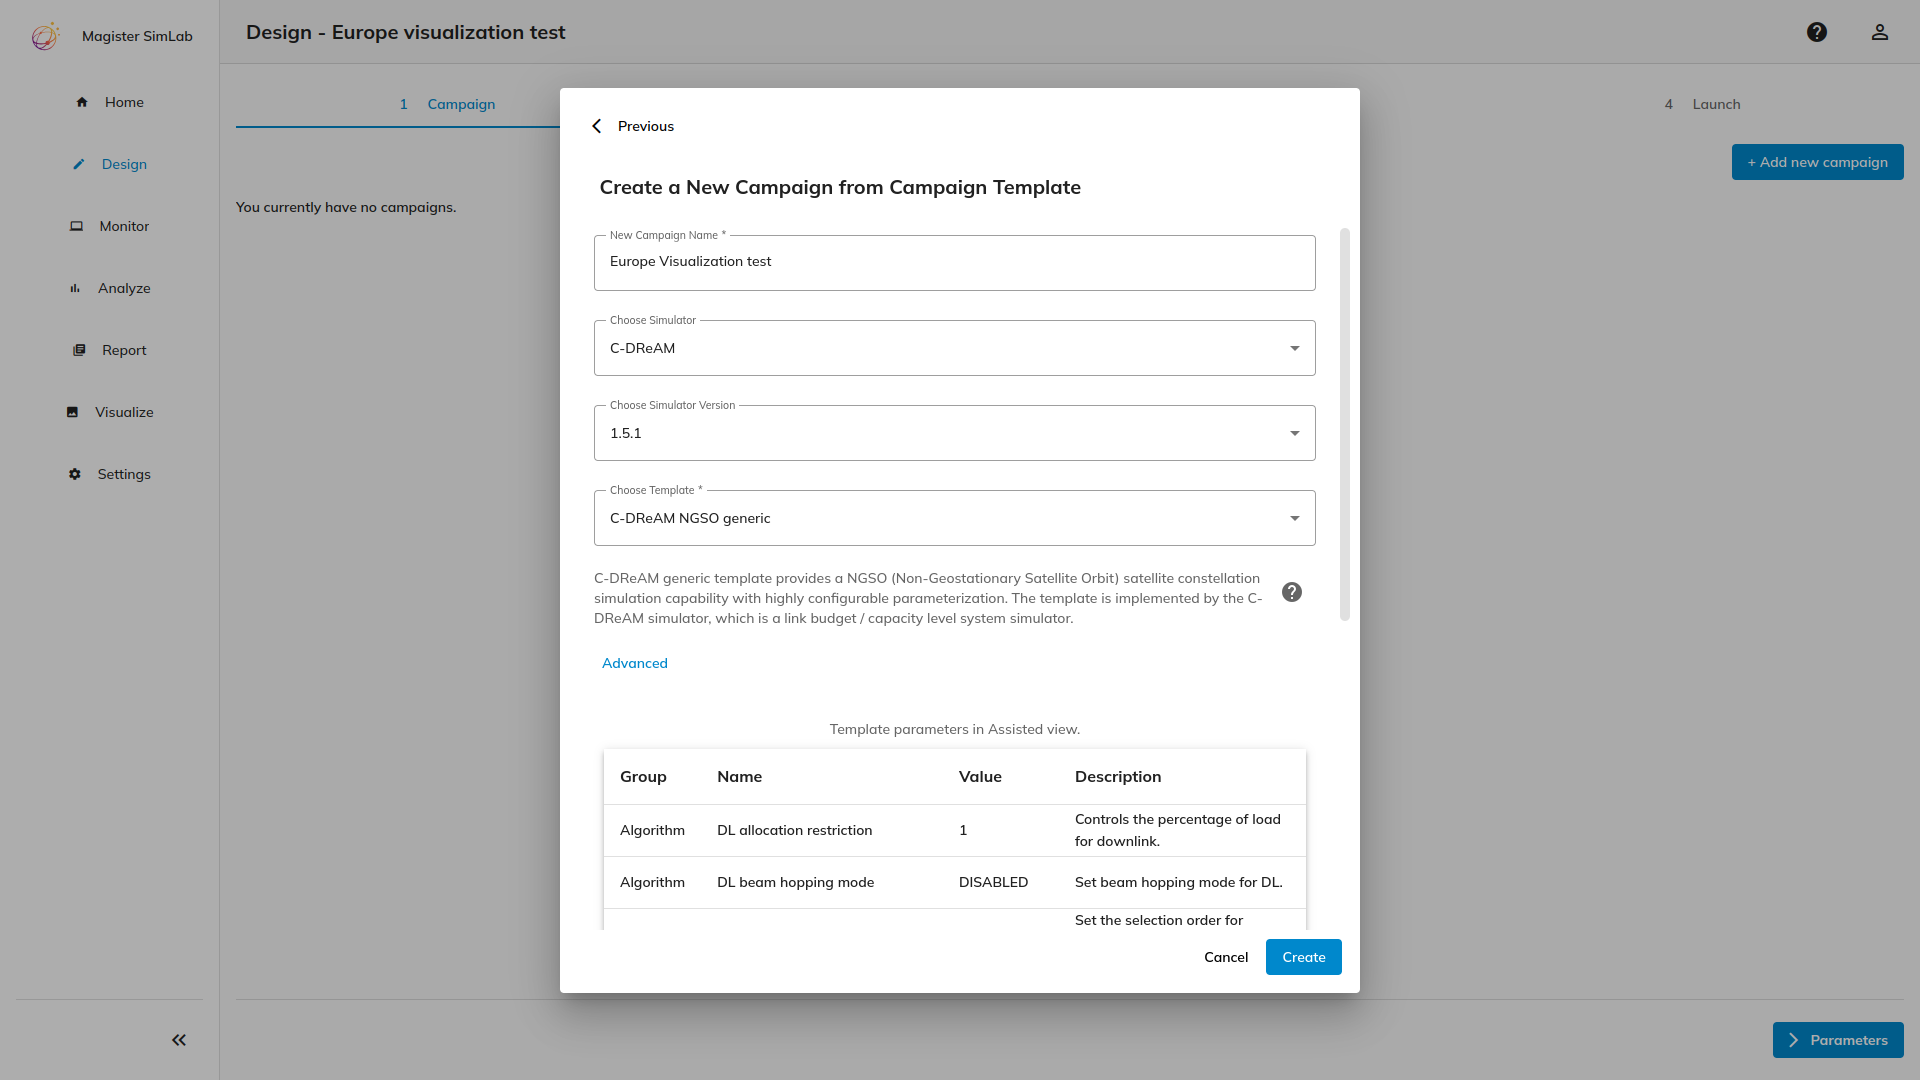
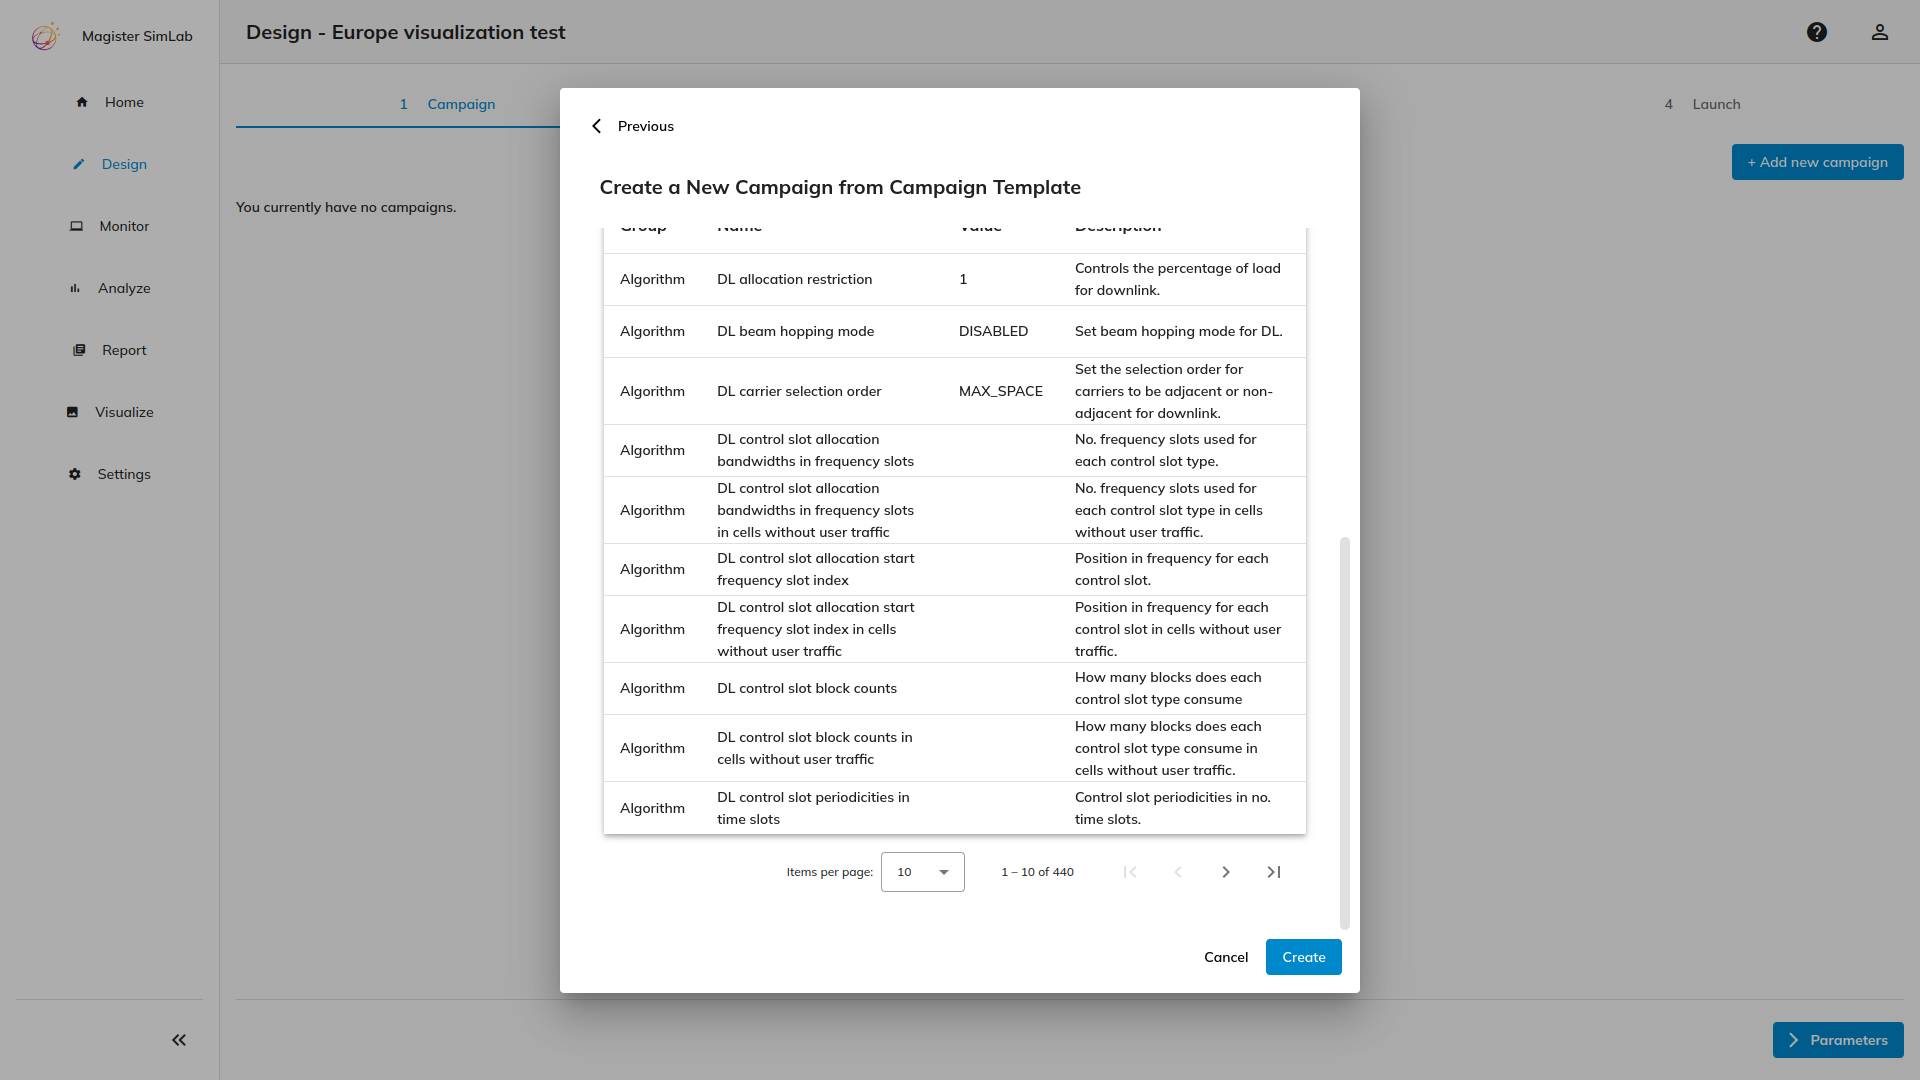
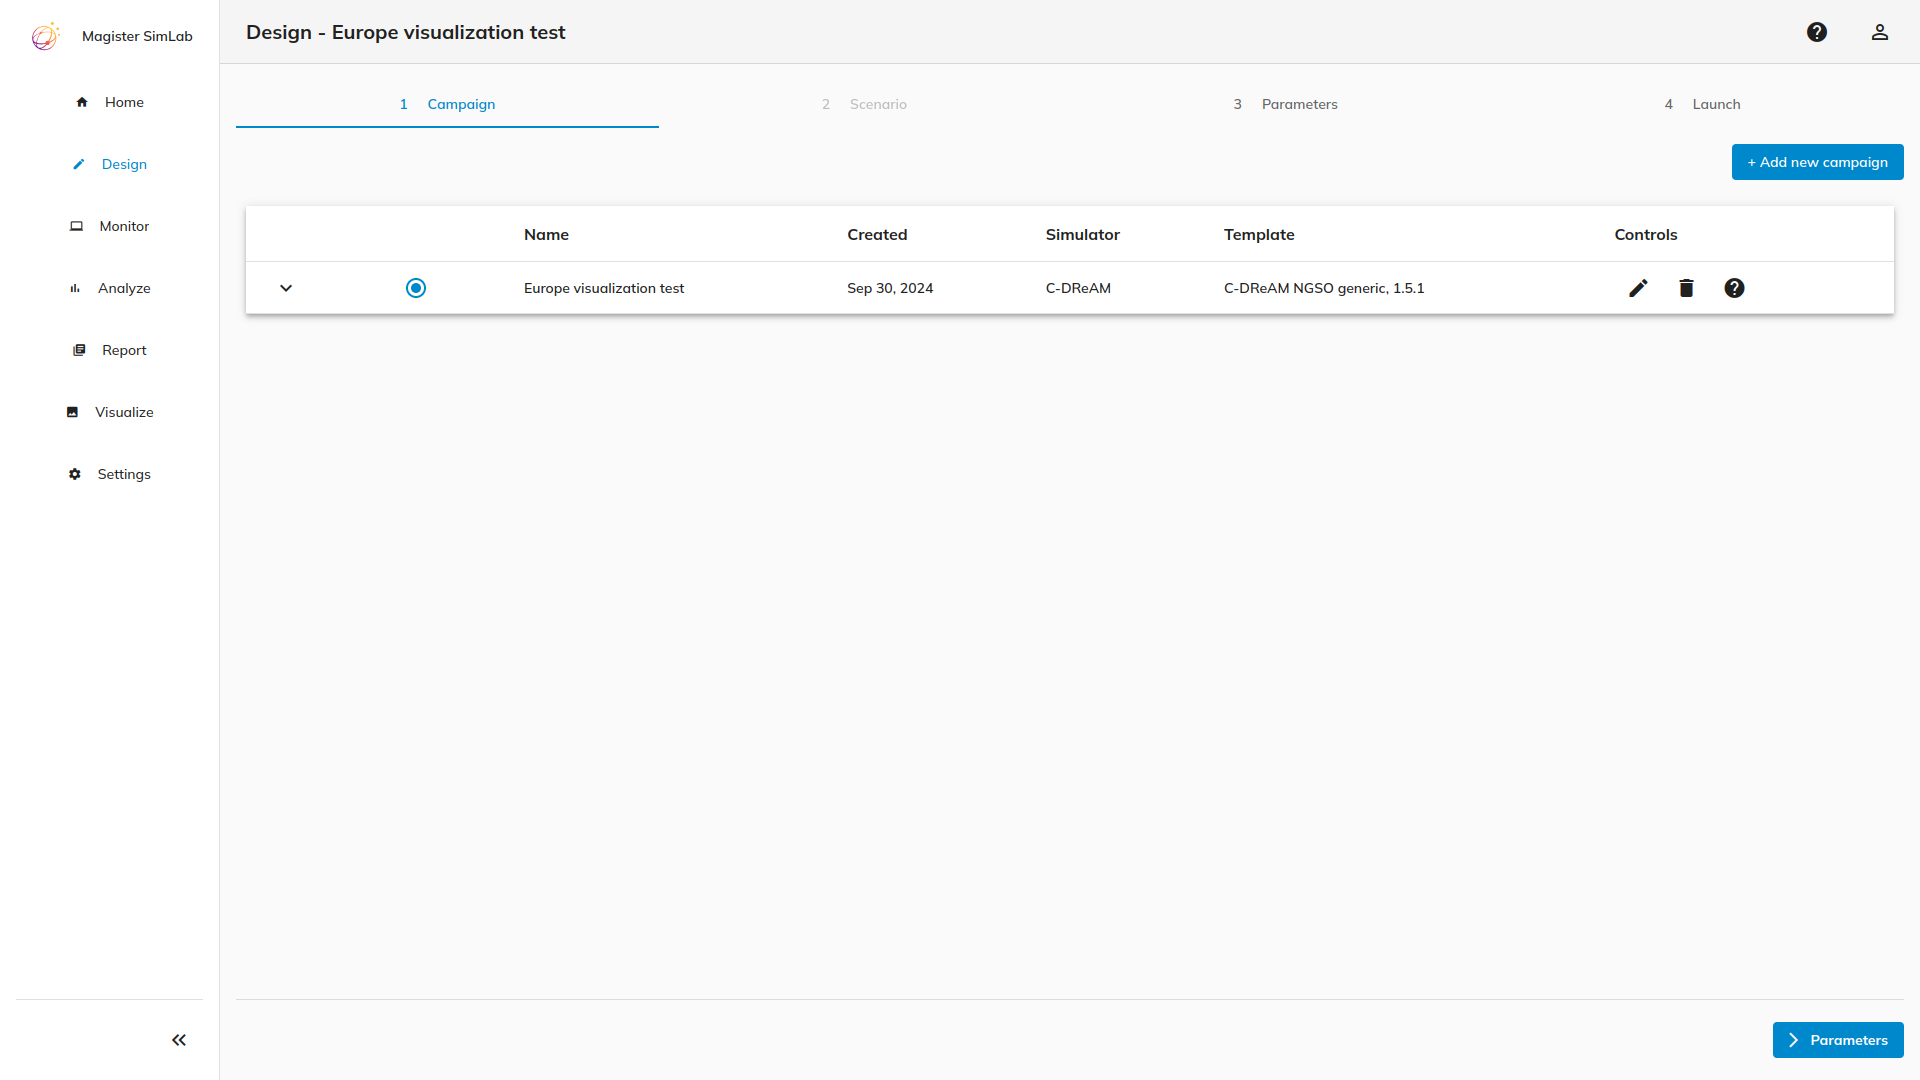
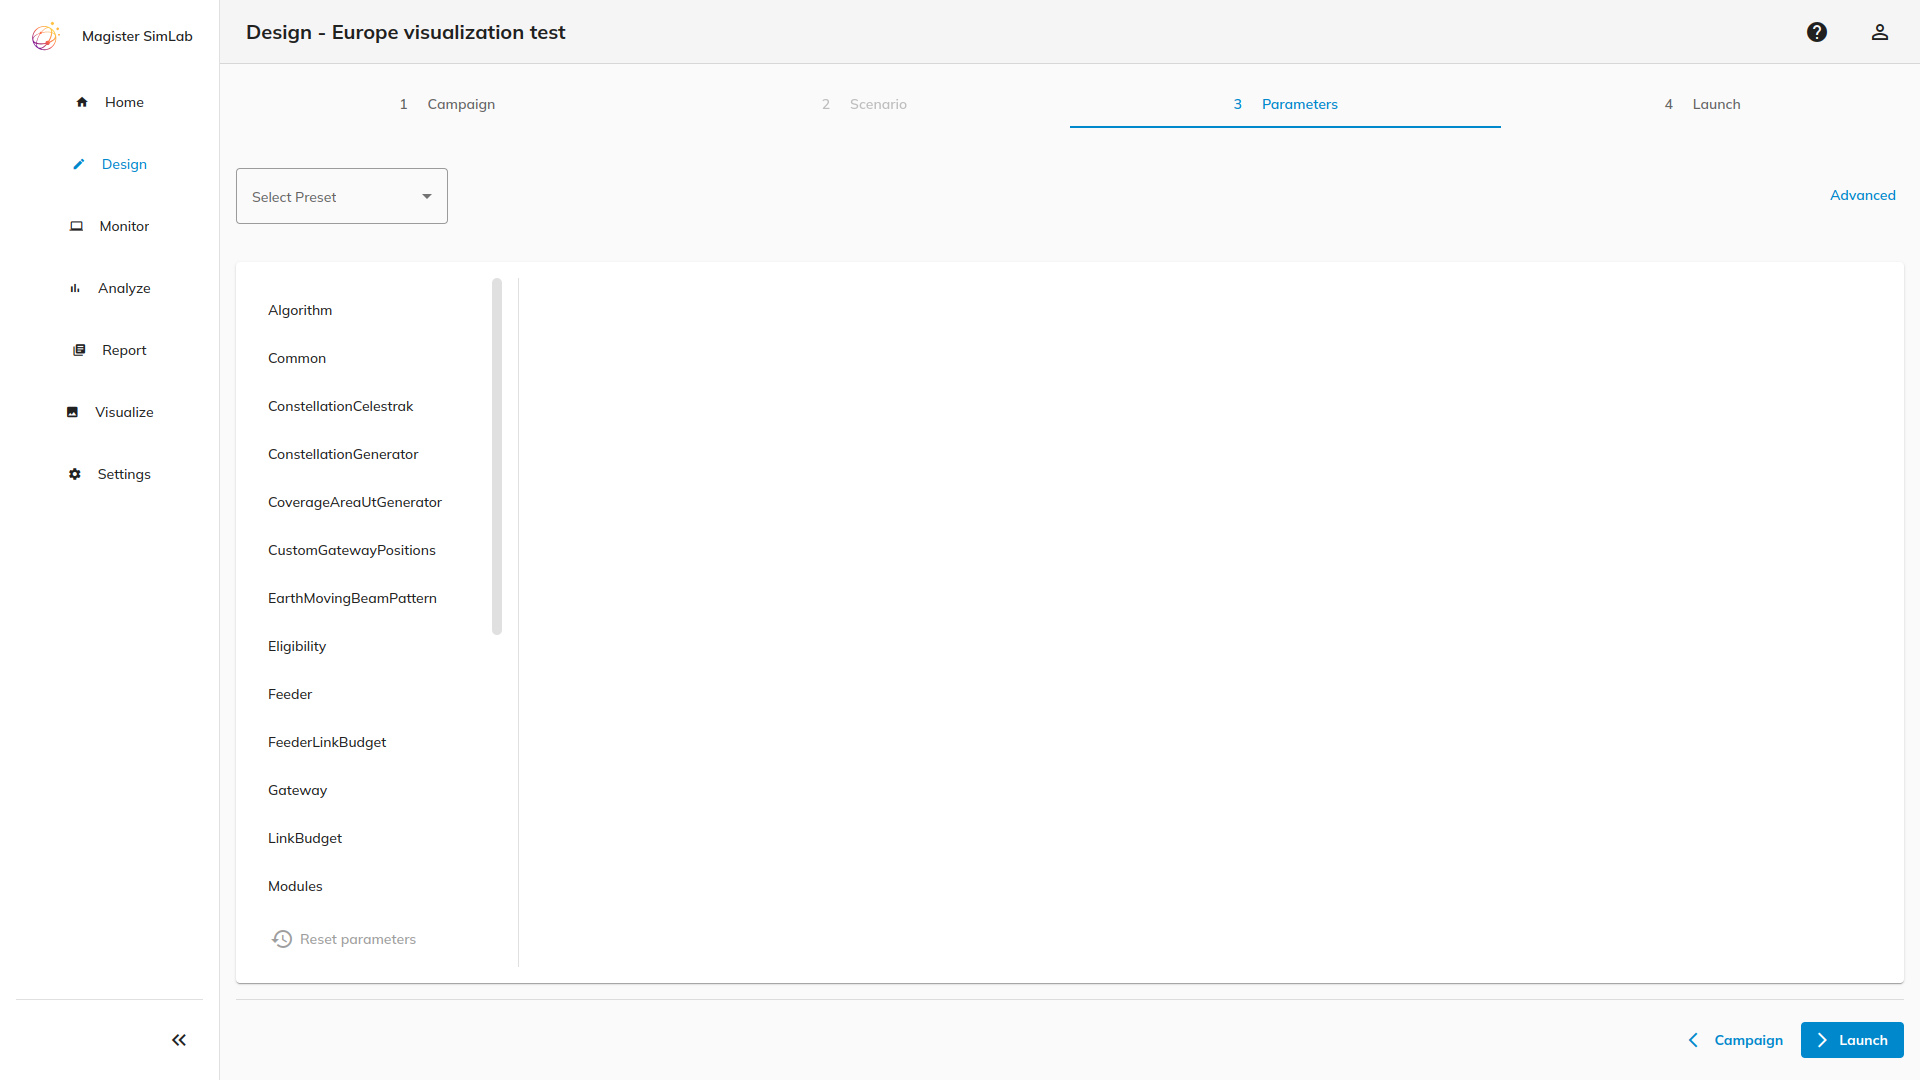
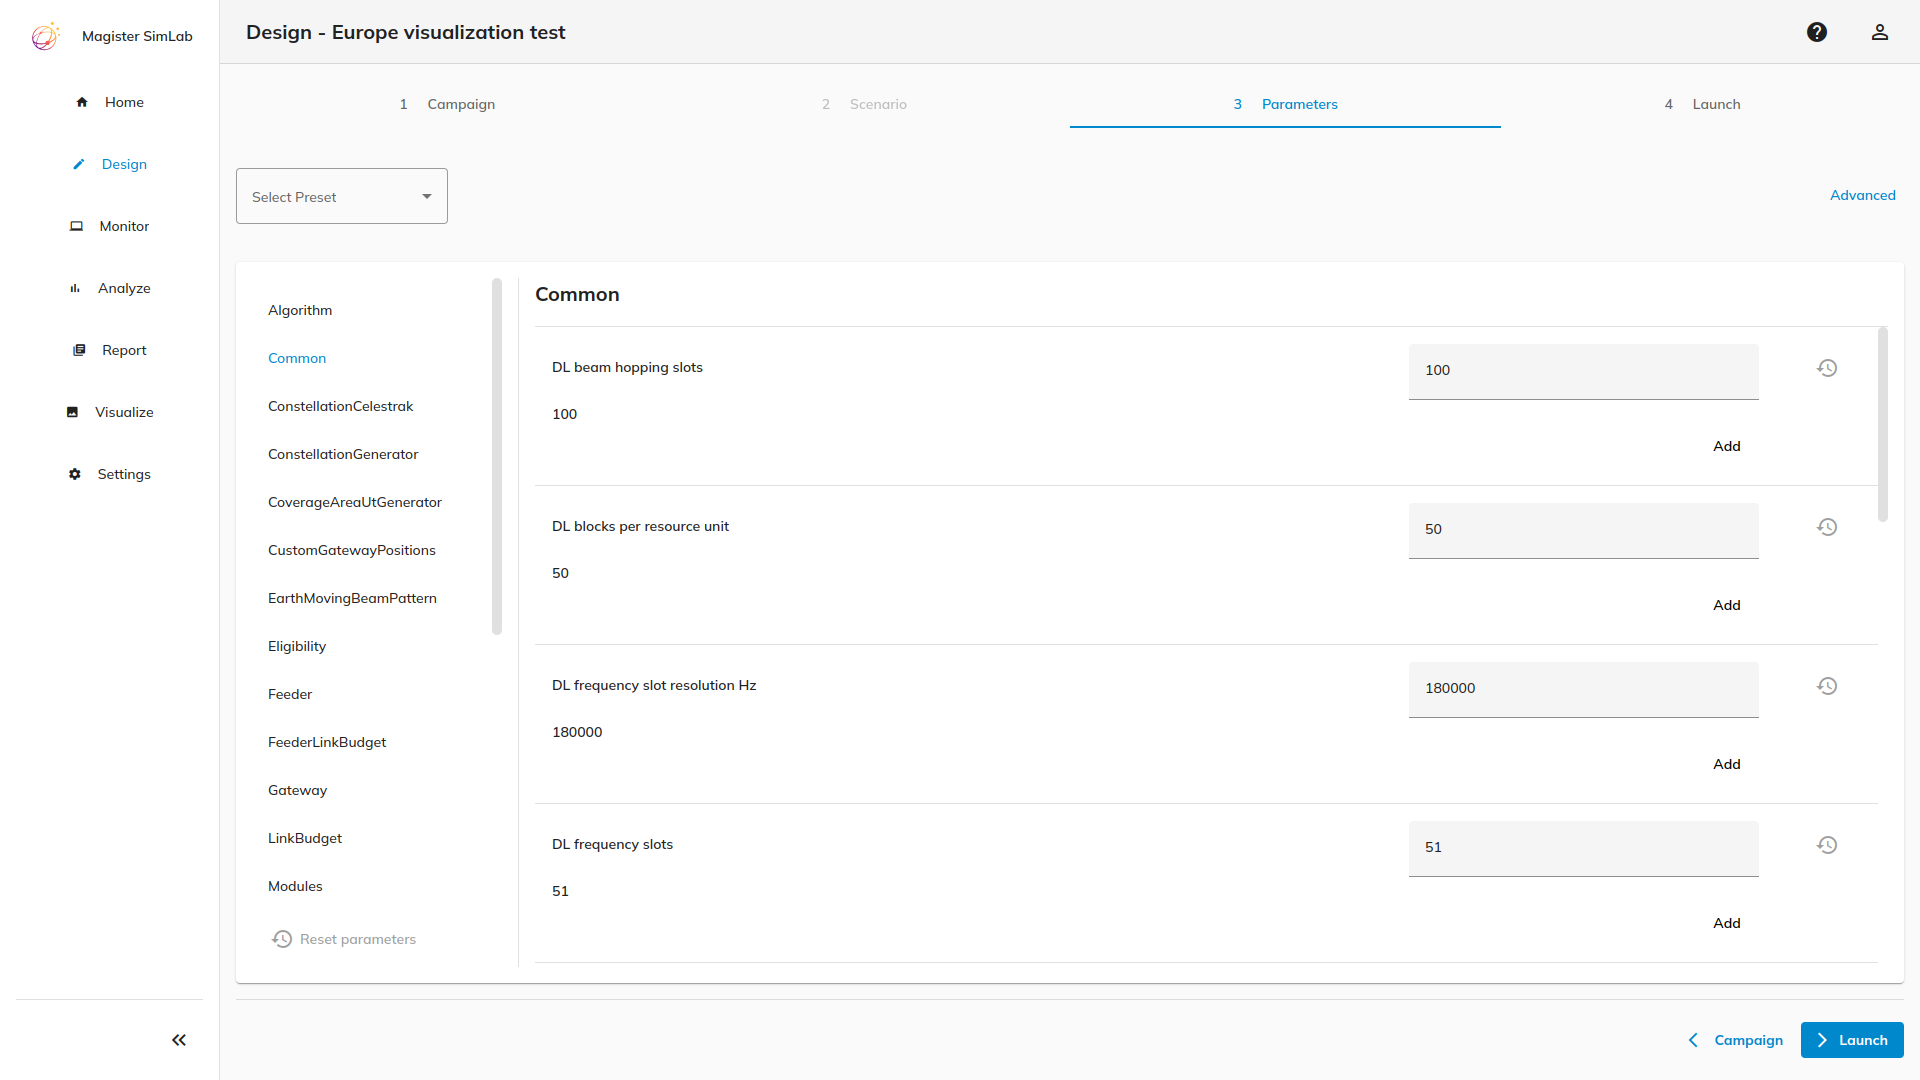
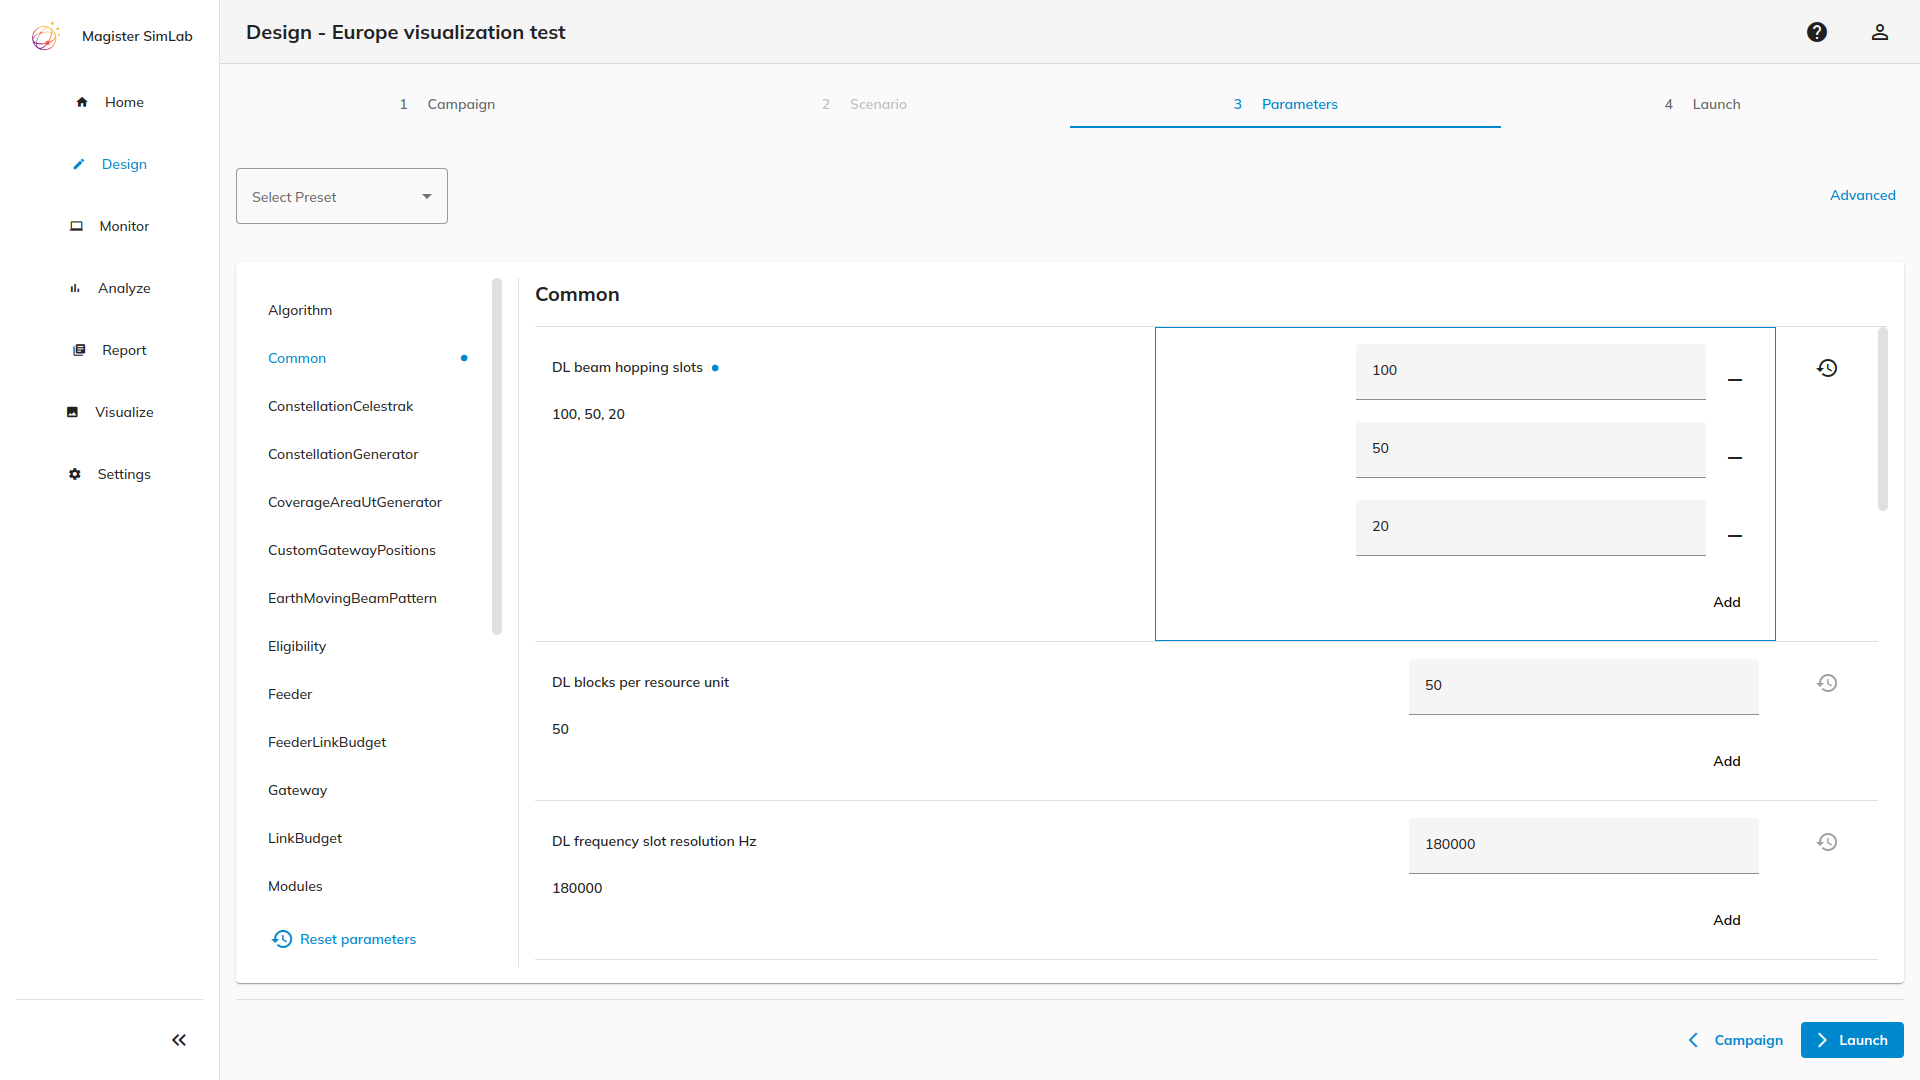
Design a Campaign
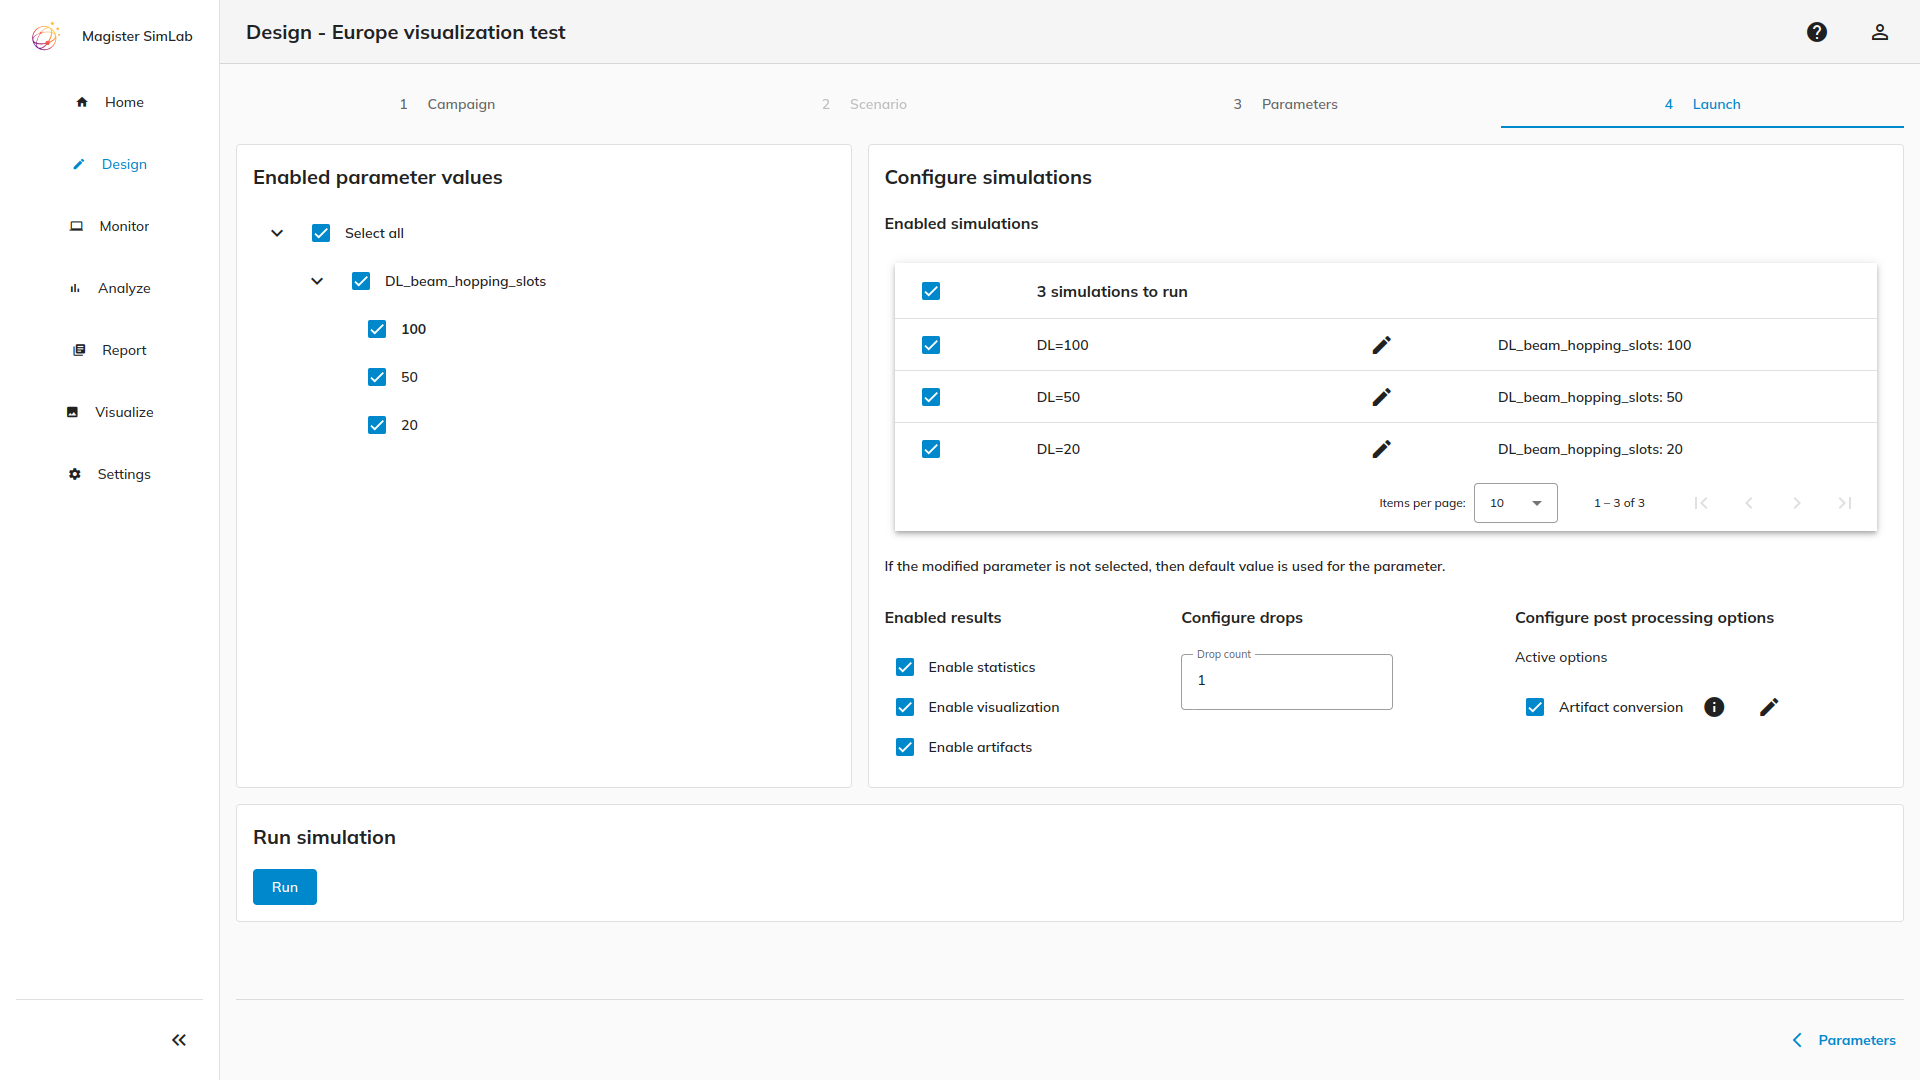
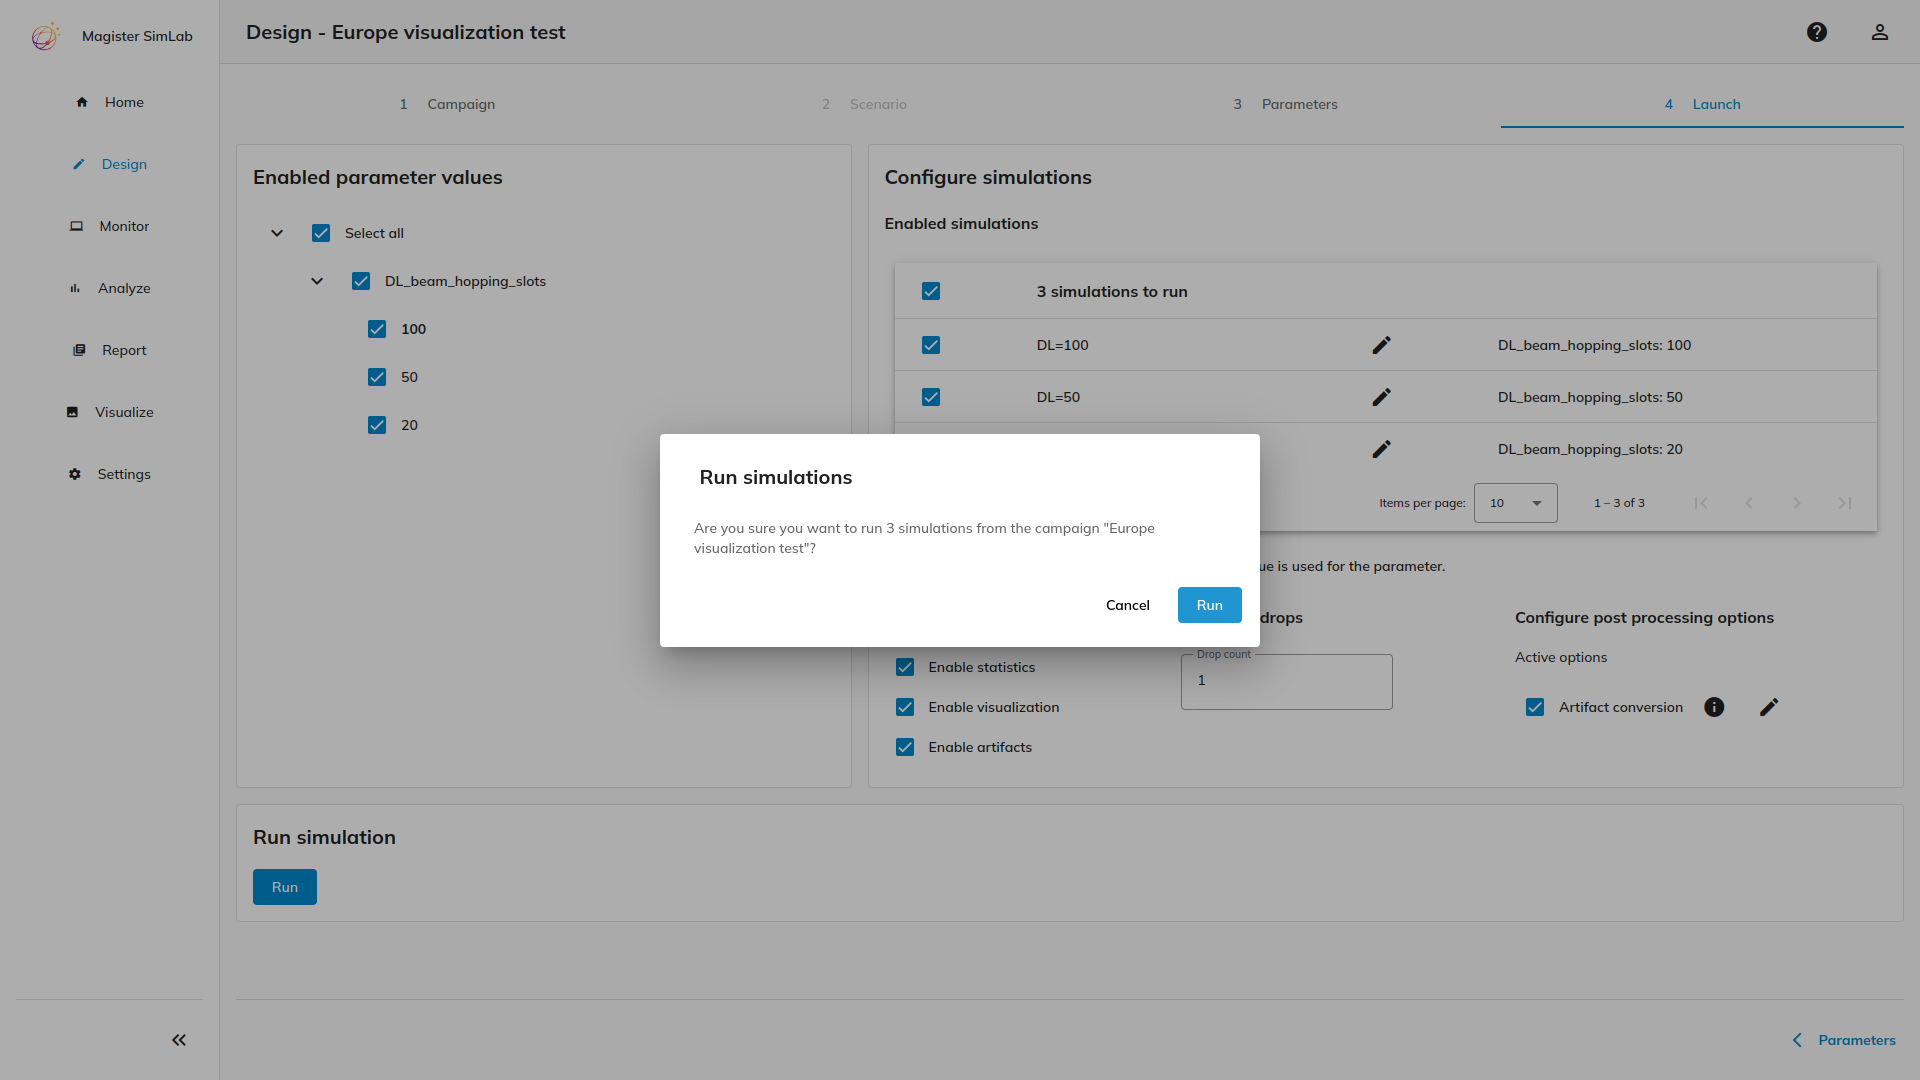
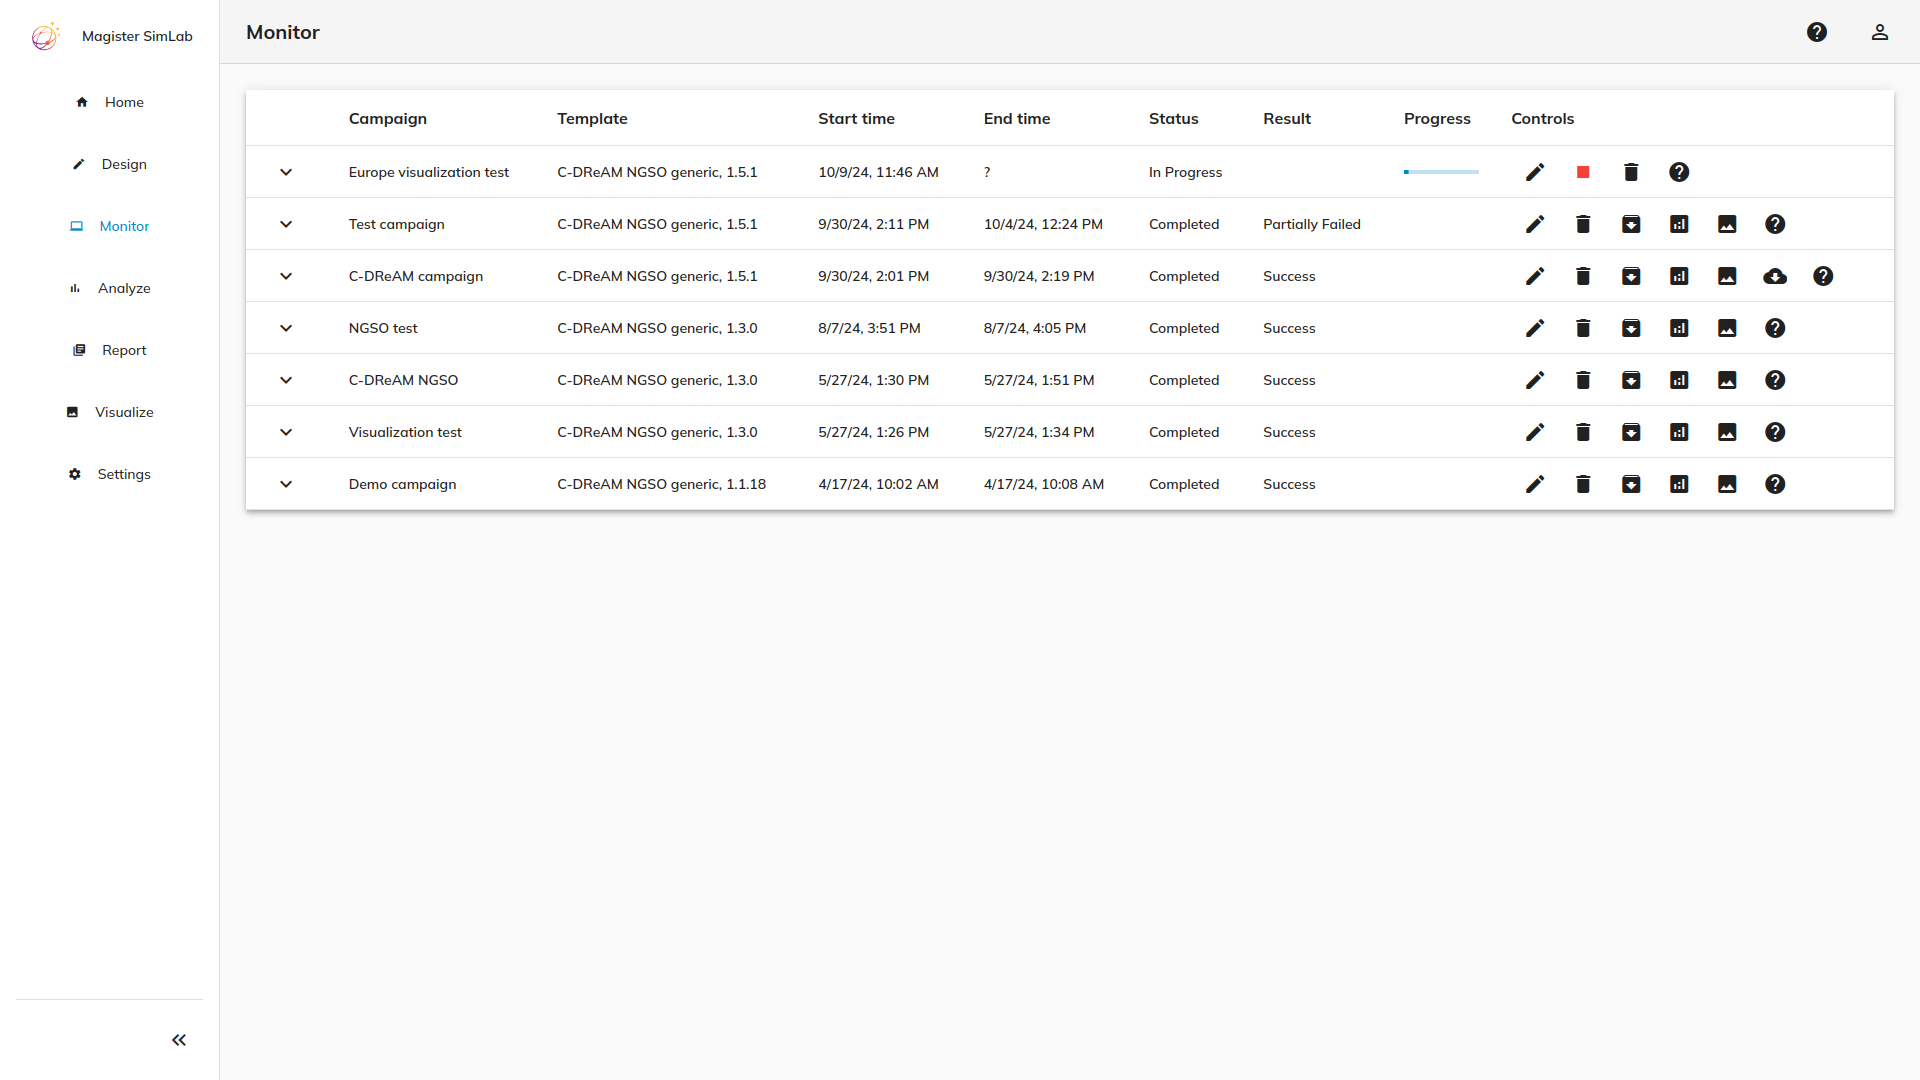
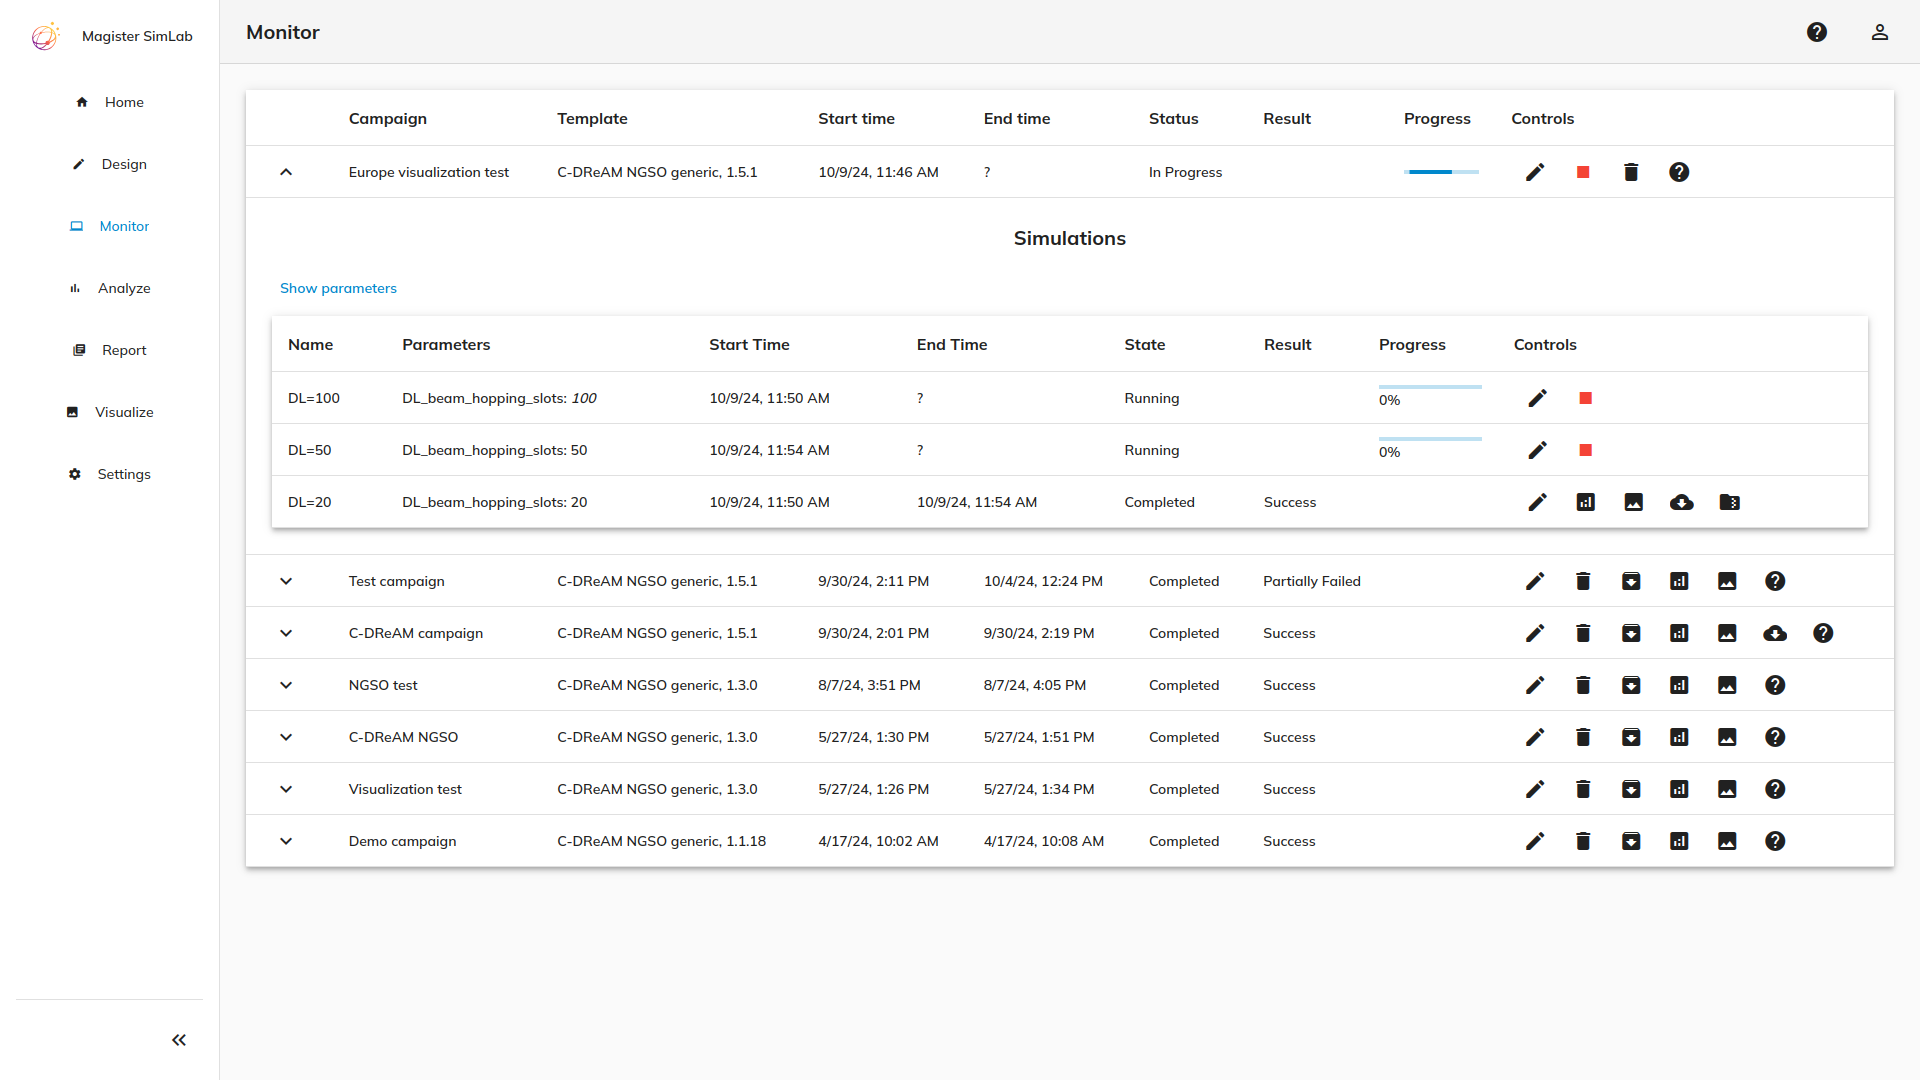
Run Campaign and Monitor Progress
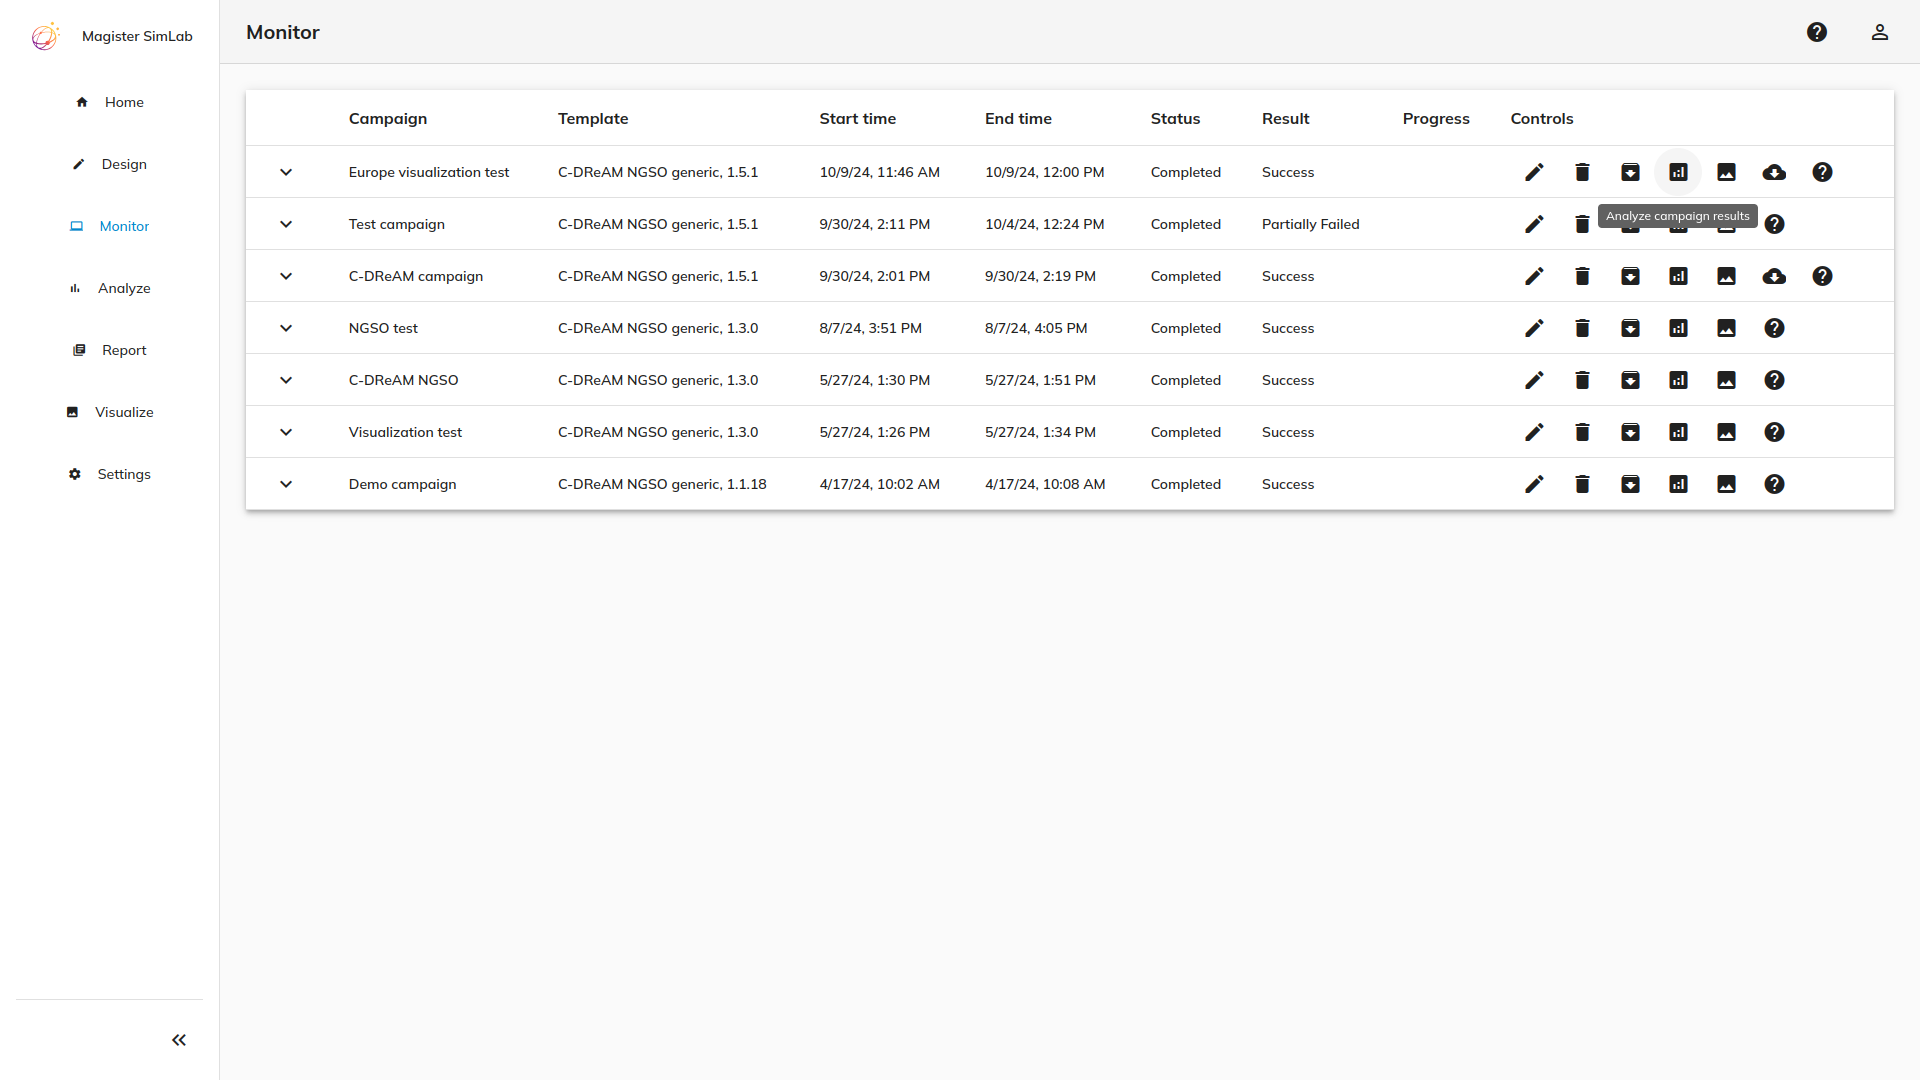
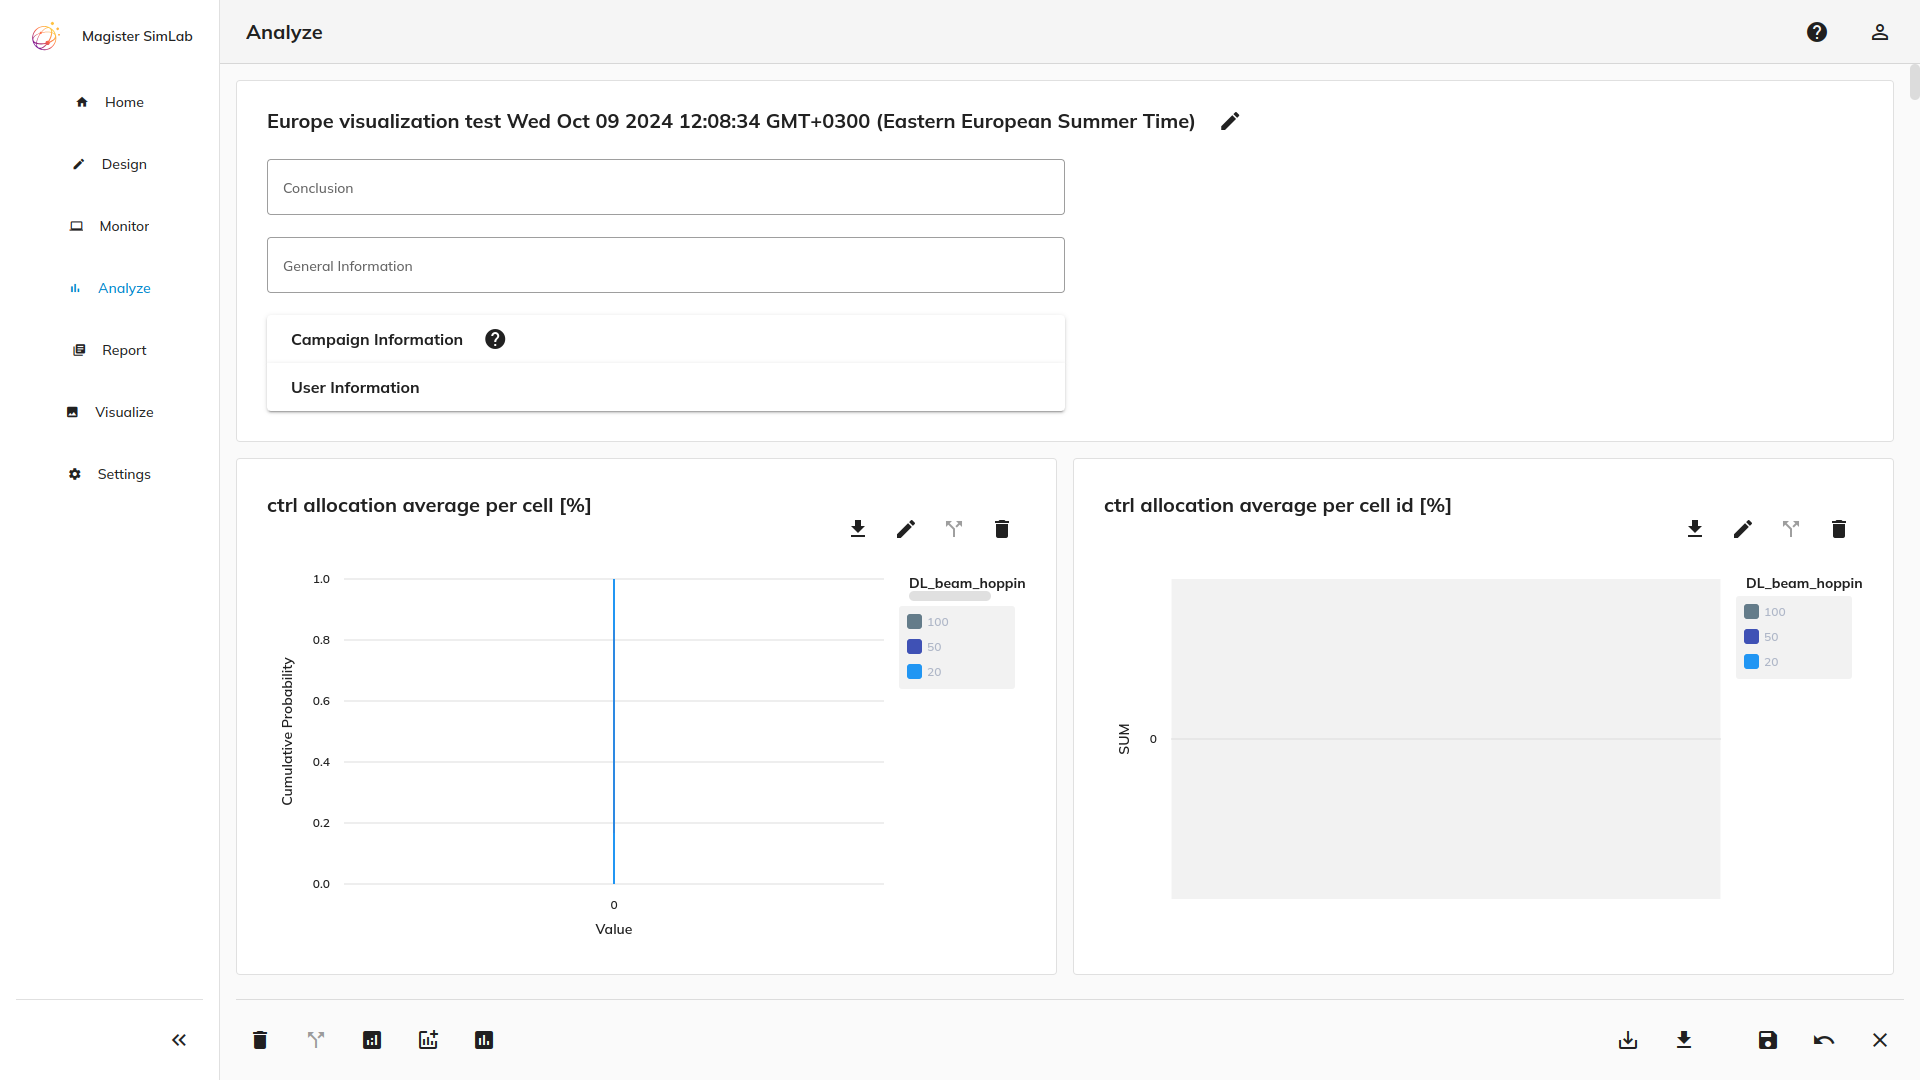
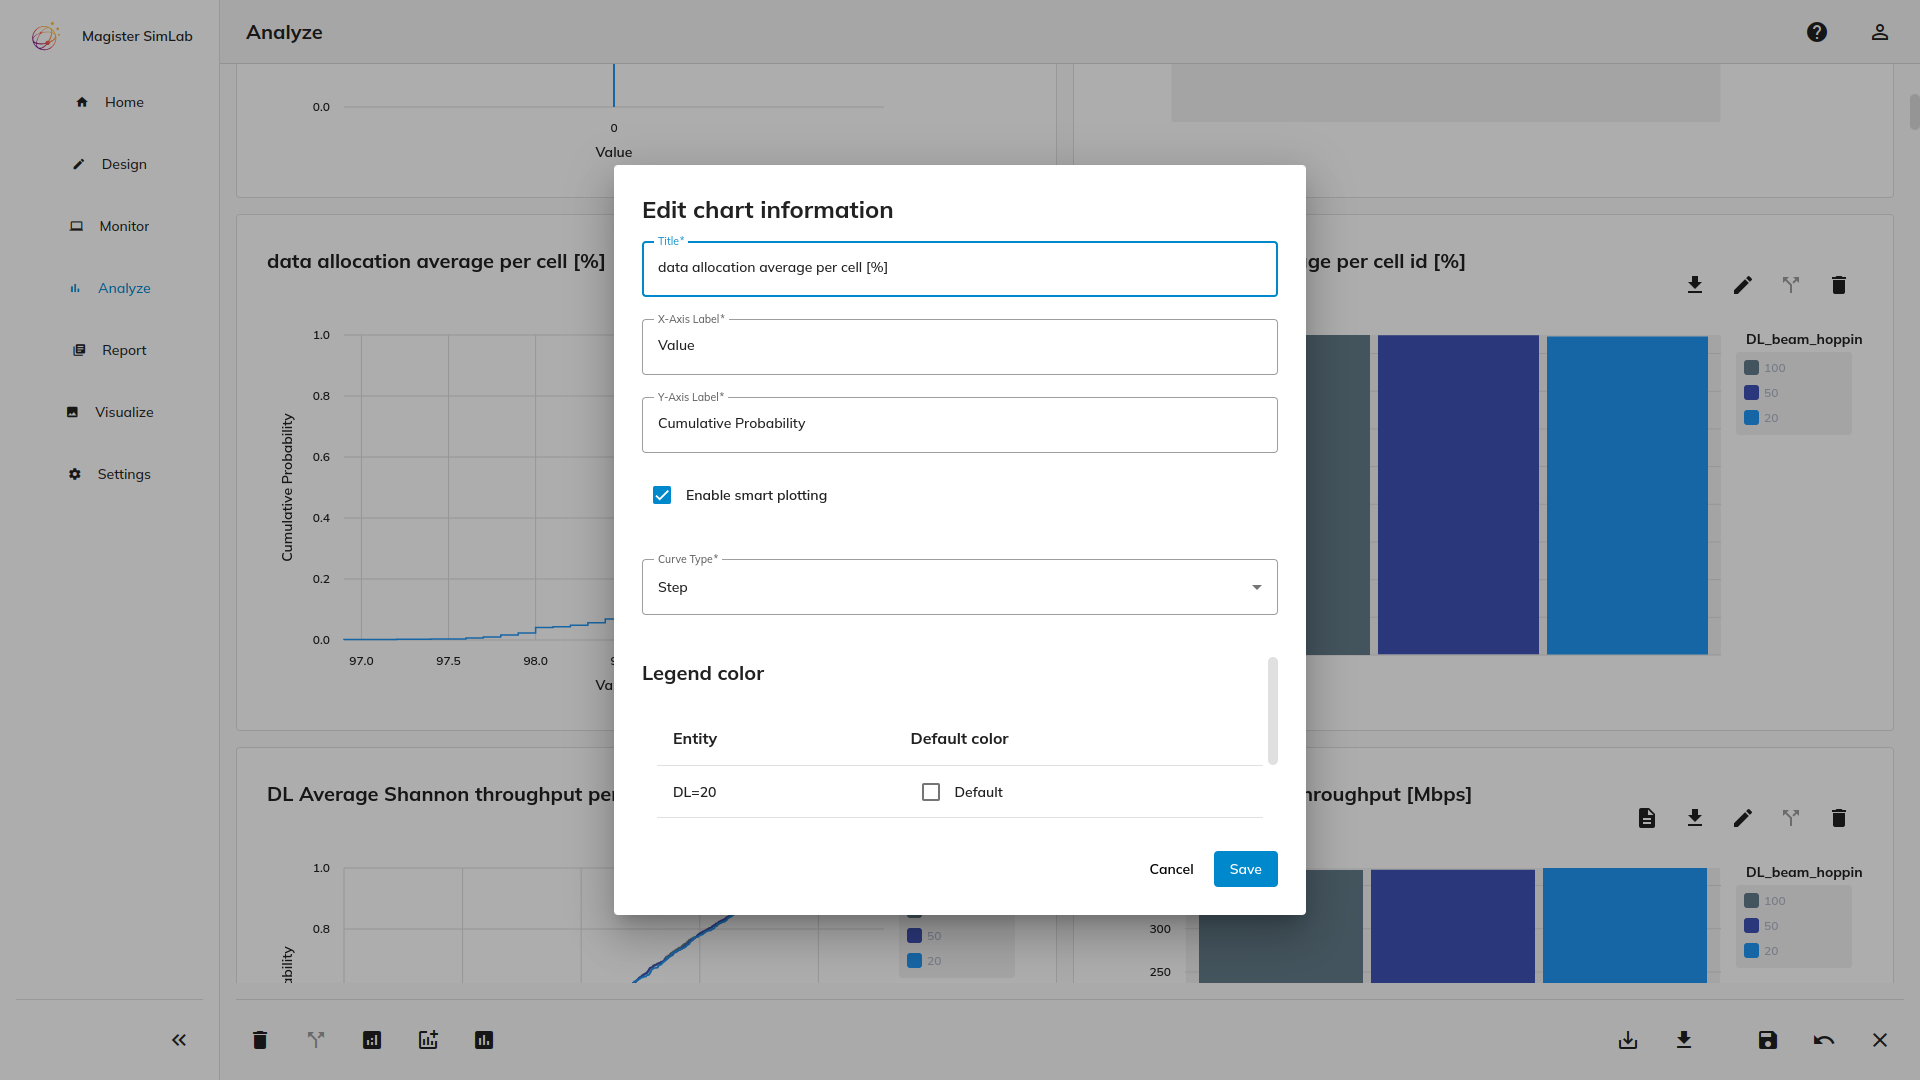
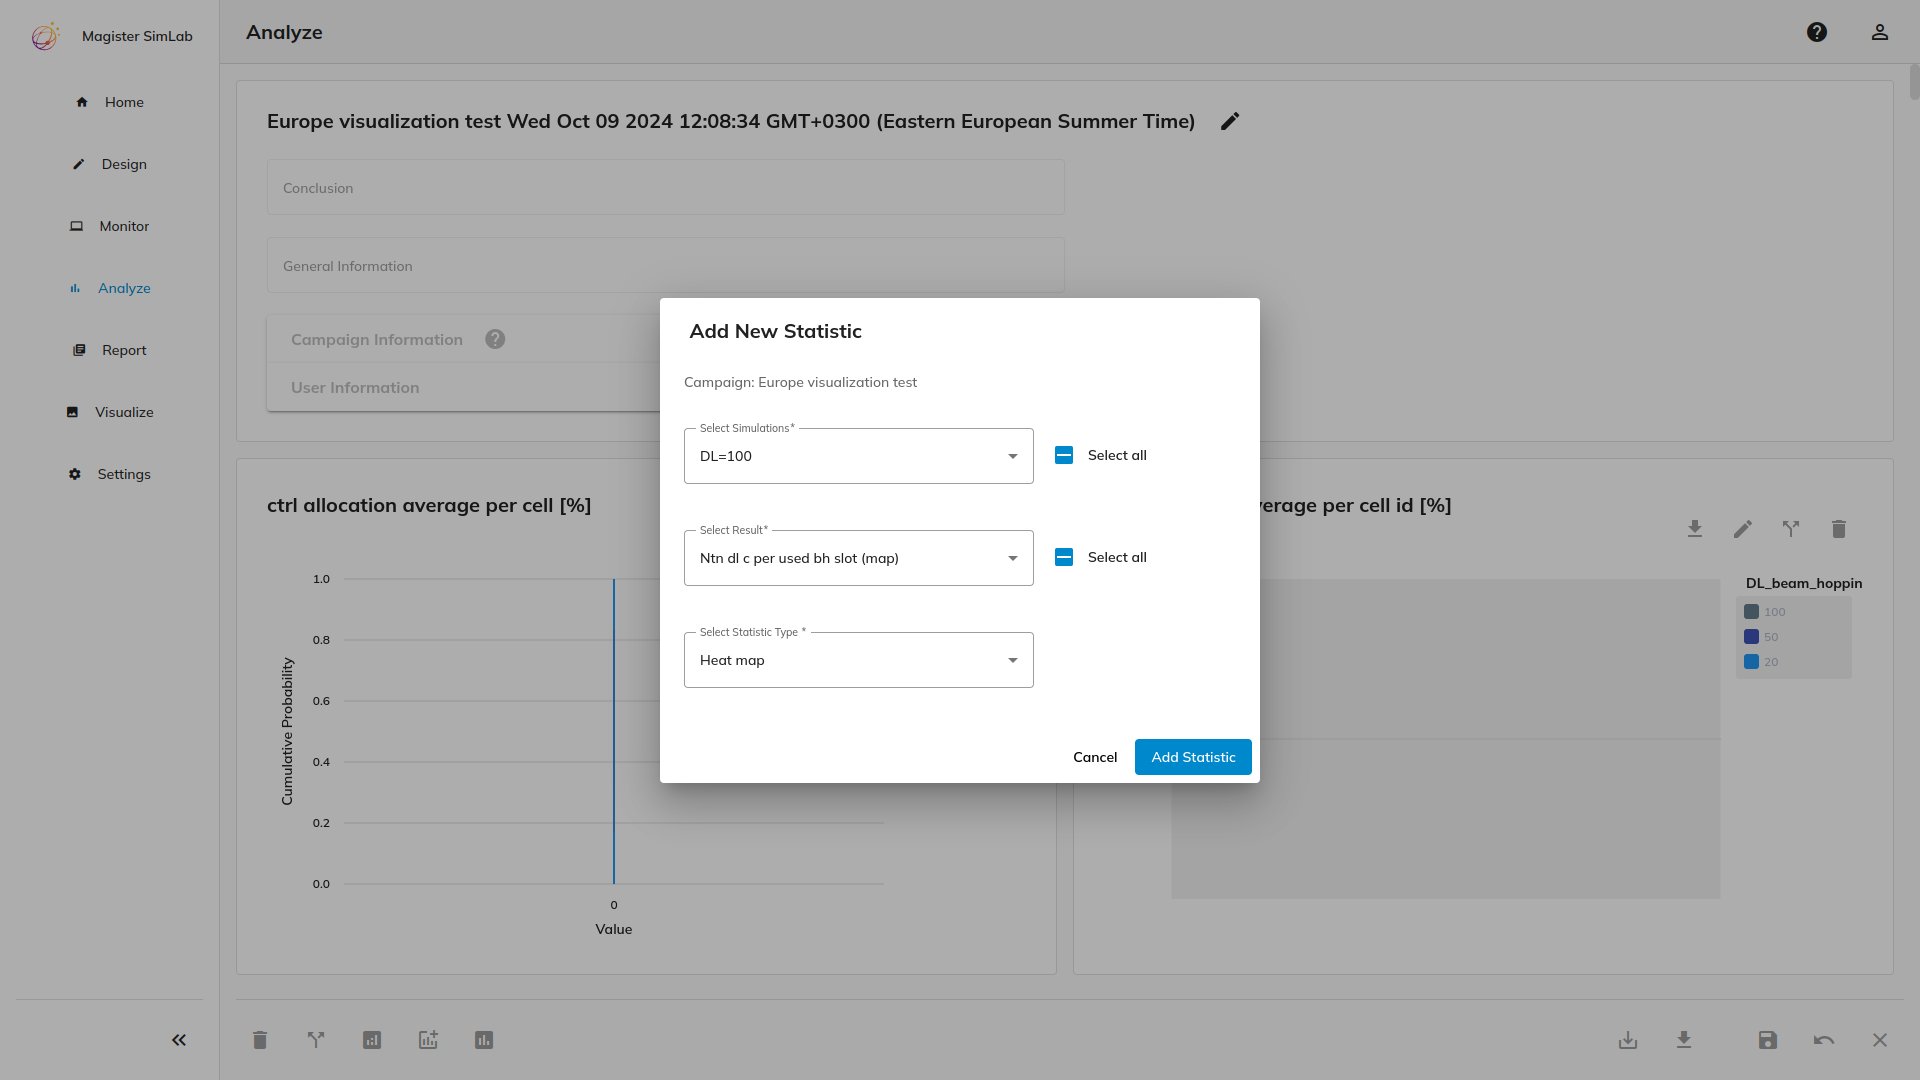
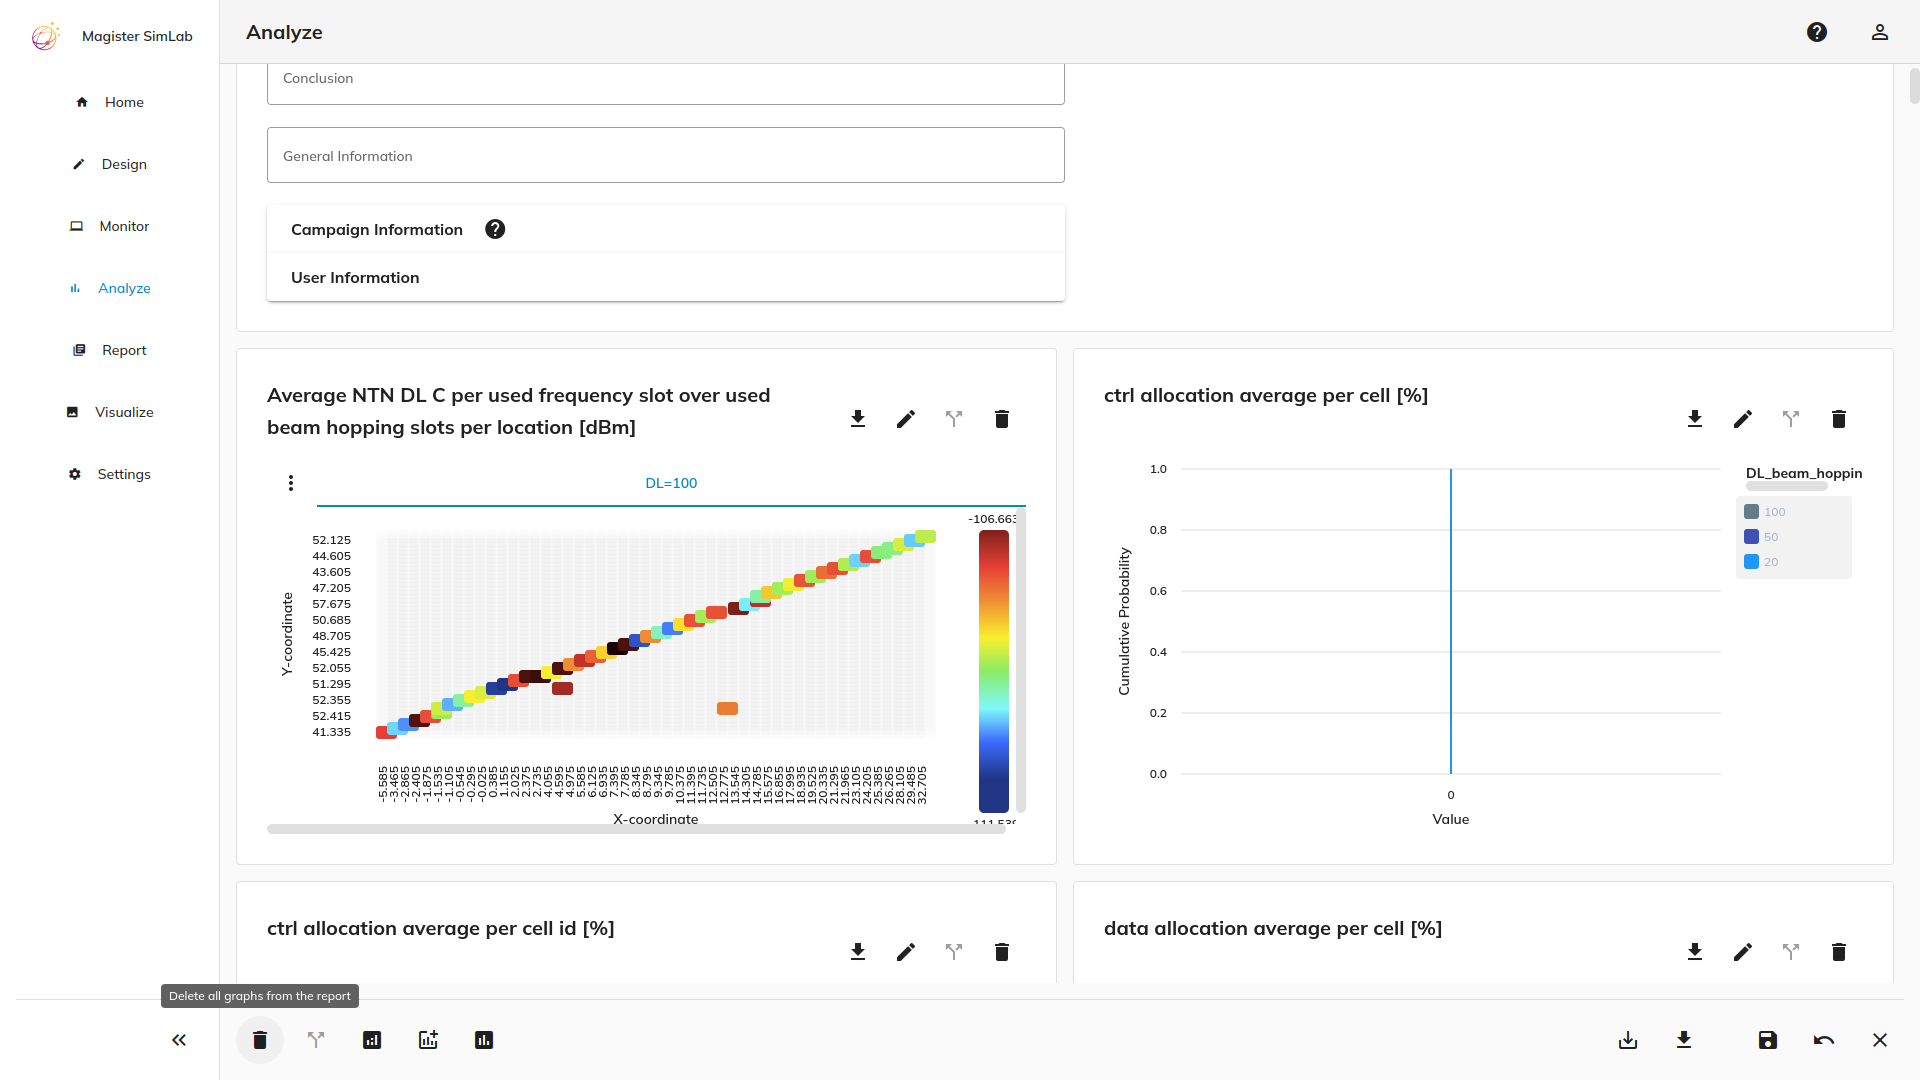
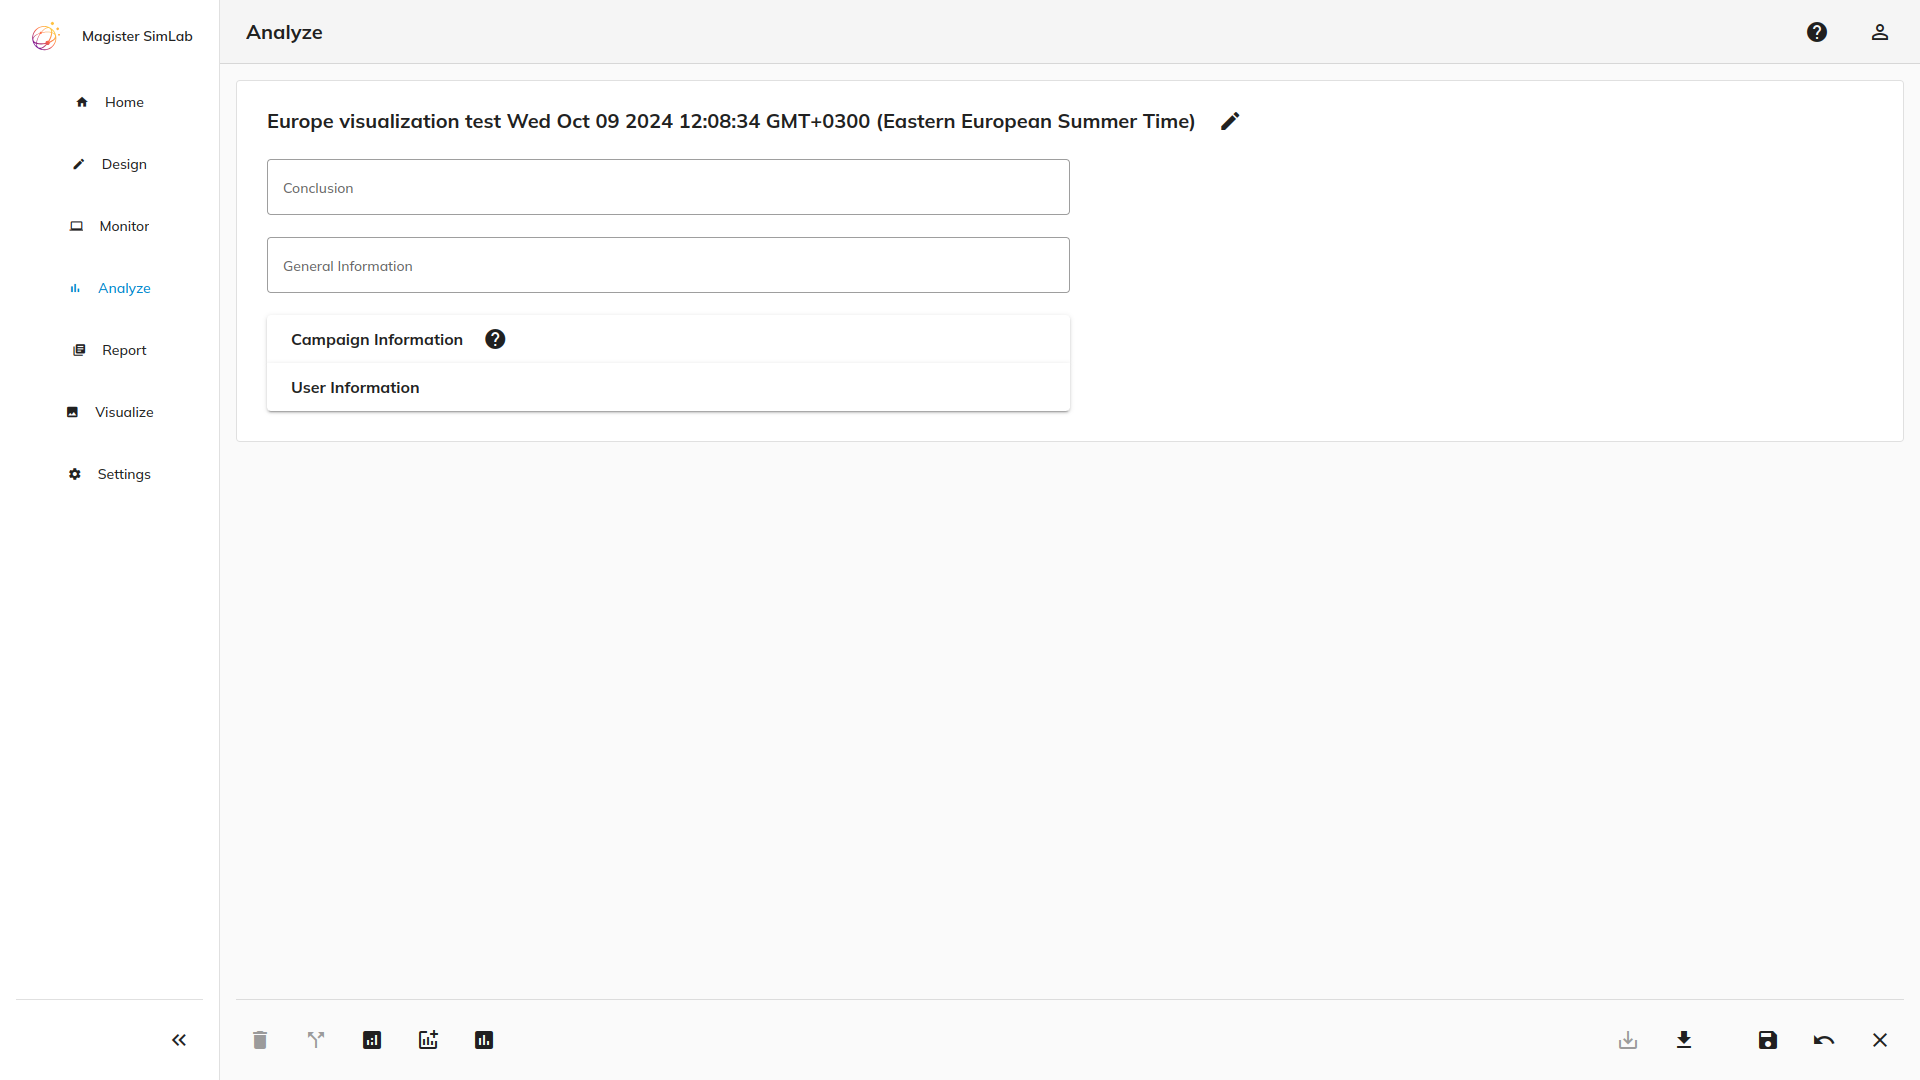
Analyze Campaign Results
Login to SimLab
With your browser, navigate to https://demo.magistersimlab.com and log in with your credentials.